
The Top 100 U.S. Banks: Sifting Through the Carnage
Longs, shorts, holds, & looking forward ...

Tariff this, tariff that. The past few weeks have been a mess for markets. Turns out, U.S.-only investors are getting a rude awakening: the rest of the world isn’t just some sideshow—it’s a legitimate place to park capital. Who knew?
But here’s the thing about chaos: it breeds opportunity.
The median big bank is down roughly 6% in the past week and 16% over the past month. Yet, zoom out, and they’re still up about 10% over the past year. That’s the kind of volatility that makes hedge fund traders either pop champagne or cry into their terminals.
Why ROTCE & P/TBV Matter More Than Ever
When financials get volatile, you need a compass. That’s why I stick to ROTCE (Return on Tangible Common Equity) and P/TBV (Price to Tangible Book Value). These aren’t just arbitrary metrics; they tell you who’s actually generating real returns on equity and whether you’re paying a premium or getting a discount.
A bank trading at a dirt-cheap P/TBV of 0.8x with a structurally sound ROTCE of 14%+? That’s an asymmetric bet. But a bank riding a high P/TBV with a declining ROTCE trend? That’s where the pain can get real.
The Data (With a Few Caveats):
Now, before we dive into the numbers, a quick disclaimer for the nitpickers:
TSFL is inflated due to the conversion factor.
Banks without 2025 ROTCE estimates or current P/TBV are excluded.
Correlation does not equal causation. (Obvious, but let’s just state it.)
Estimates are as of month-end February, and analysts get things wrong.
Past performance is not future performance.
With that out of the way, let’s get into the real insights.
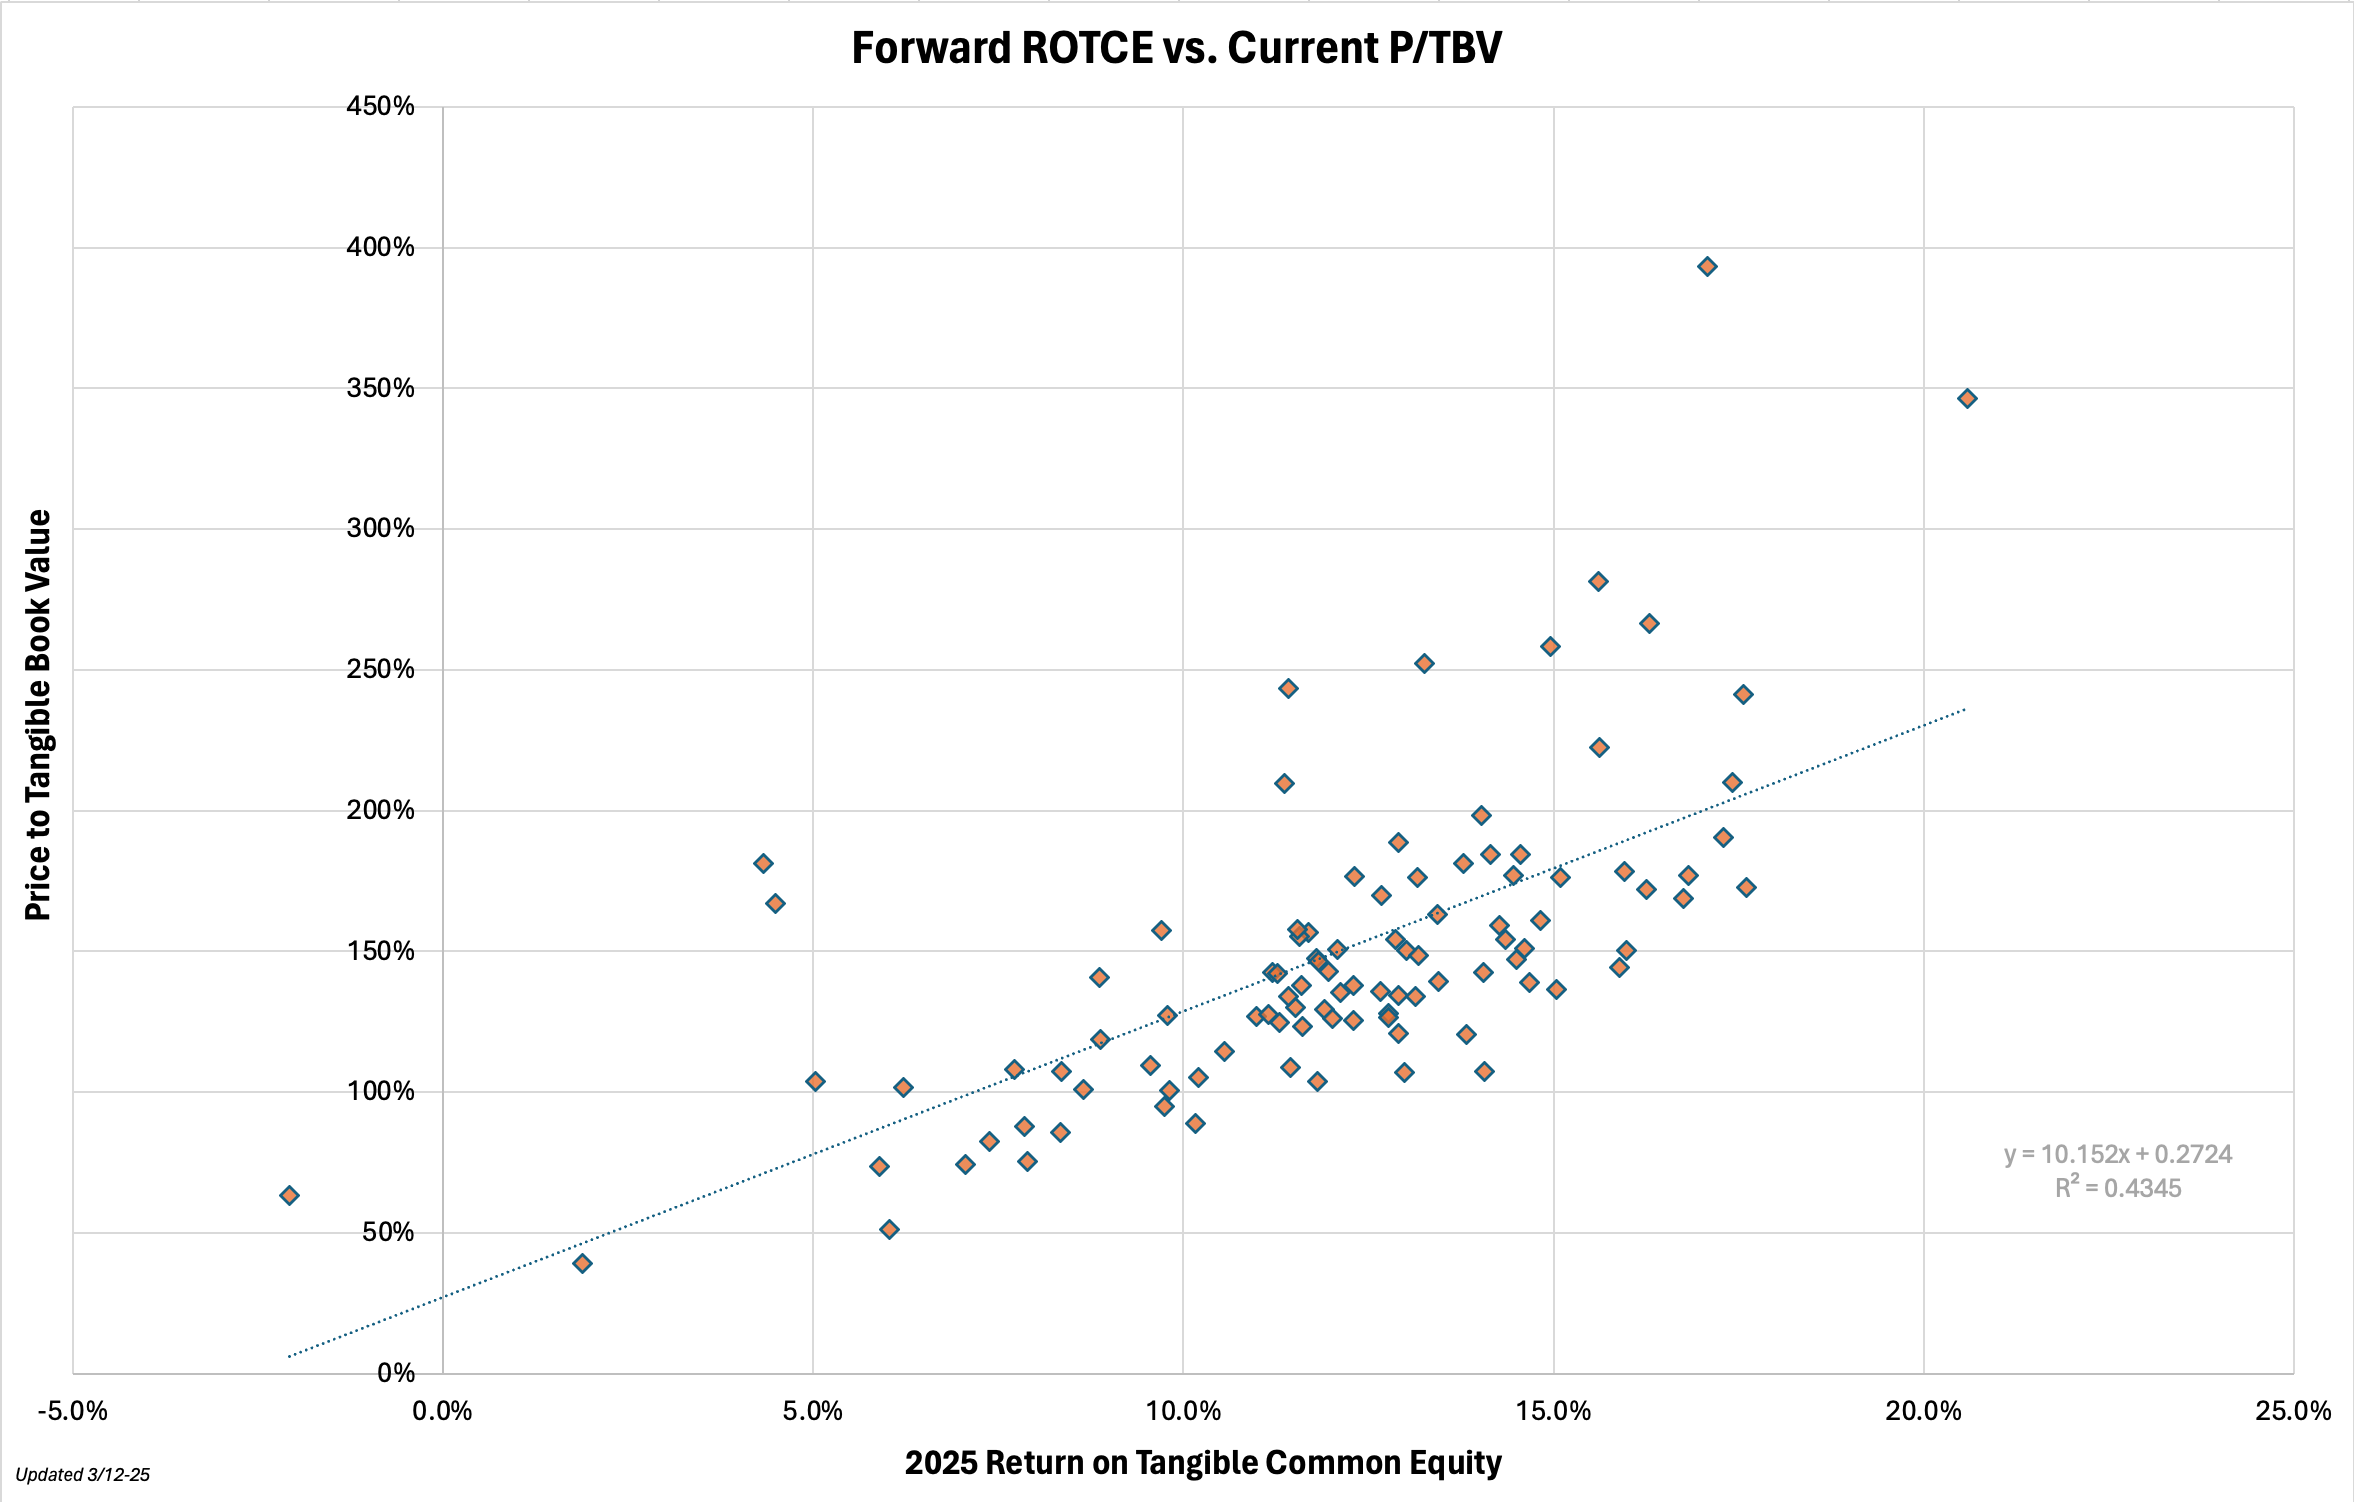
A 15% ROTCE is currently being valued anywhere between 1.5x to 2.0x TBV. A 10% ROTCE lands in the 1.0x to 1.5x TBV range. And a 5% ROTCE? You better hope they’re really discounted.
A Bank Investors Cheat Sheet:
If you want to separate the winners from the losers in banking, you need a system—not vibes, not headlines, and definitely not analyst upgrades. A real framework that cuts through the noise.
Here’s what I track and why it matters.
Valuations (P/TBV, P/E, etc.) – Because price matters. A great bank at the wrong price is a bad investment. P/TBV (Price to Tangible Book Value) tells you how much the market is willing to pay for a bank’s tangible assets. Historically, high-ROTCE banks command premium multiples, while low-ROTCE banks trade near or below book. P/E (Price to Earnings Ratio) is useful alongside ROTCE and growth—trailing P/E shows what a bank earned, forward P/E reflects expectations. The spread between the two tells you if the market is pricing in growth, stagnation, or decline.
ROTCE (Return on Tangible Common Equity) – The biggest driver of valuation. We already covered the ranges: 15%+ earns a premium, 10% is solid but nothing special, and below that, you need a real turnaround story.
EPS Growth – Because a bank’s stock price follows its earnings over time. What drives EPS growth? Loan expansion (without reckless credit risk), higher net interest margins, operational efficiency, and smart buybacks. If a bank is growing EPS while maintaining strong ROTCE, it’s a compounding machine. If EPS is flat or declining, you need to ask why.
CET1 Ratio (Common Equity Tier 1 Capital Ratio) – Measures a bank’s core financial strength. Too low (<10%)? They’re constrained, limiting buybacks, dividends, and growth. Too high (>13%)? They can go on offense—deploy capital, acquire, or ramp up buybacks. The best banks balance capital efficiency with flexibility.
Price Changes (1 Week, 3 Month, 1 Year) – Because momentum (or lack of it) tells you what the market is thinking. Tracking short-term and long-term price movements helps you spot overreactions, downtrends that actually make sense, and momentum trades. If a bank is down big but the fundamentals are strong, it’s an opportunity. If a bank is running hot but fundamentals are deteriorating, it’s a trap.
If you’re a premium member, read on for the names …
