How to Value a Bank: A Practical Investor's Guide
Practical guide to bank valuation: P/TBV multiples, ROTCE analysis, and earnings projections. Learn what drives bank stock prices.

A no-nonsense approach to pricing bank stocks and understanding what actually drives valuations.
Ever wondered how to figure out what a bank is really worth? Not in the textbook sense that is technically true but practically useless, but in a way that actually helps you make investment decisions?
Buckle up. We’re diving into bank valuation with a focus on what works in practice. This guide will show you how to price a bank and what matters when making investment decisions in the banking space.
Appropriate timing given the recent breakout in financials and banks.
If you like reading about markets, investing, and financials, subscribe here.
The Bedrock: Tangible Book Value (TBV)
Understanding the foundation of bank valuation starts here.
Jamie Dimon once said: “If our asset and liability values are appropriate, and we believe they are, and if we can continue to deploy this capital profitably, we now think that it can earn approximately 17% return on tangible equity for the foreseeable future. Then, in our view, our company should ultimately be worth considerably more than tangible book value.”
Dimon was emphasizing the importance of accurately valuing assets and liabilities. If these values are correct, tangible book value becomes a reliable measure of the company’s worth.
What Is TBV?
Tangible Book Value is the bank’s bare-bones net worth. It is what would be left if you sold all the bank’s assets and paid off all its debts.
How To Calculate TBV:
Start with total shareholder equity. This represents the net assets of a company, which is the difference between total assets and total liabilities. It includes both tangible and intangible assets.
Subtract intangible assets. This includes goodwill, brand value, and intellectual property. Historically, banks have not been known for having significant brand value or IP compared to industries like technology or consumer goods. Goodwill arises when one company acquires another for a price higher than the fair market value of its identifiable assets and liabilities. It represents the value of brand name, customer relationships, employee relations, and other factors contributing to reputation and profitability.
Subtract preferred equity (if any). Preferred shares sit between debt and equity in the capital stack. Their holders get paid dividends before common equity holders but do not have voting rights. Banks issue preferreds primarily to meet capital requirements. They count towards Tier 1 capital (a major regulatory benchmark) as long as they meet certain criteria. More importantly, banks issue these because they are typically much cheaper than issuing common stock. Issuing common shares gives investors a slice of business returns forever (which can be north of 10% or higher) whereas preferreds issue only a fixed coupon, typically in the high single digits.
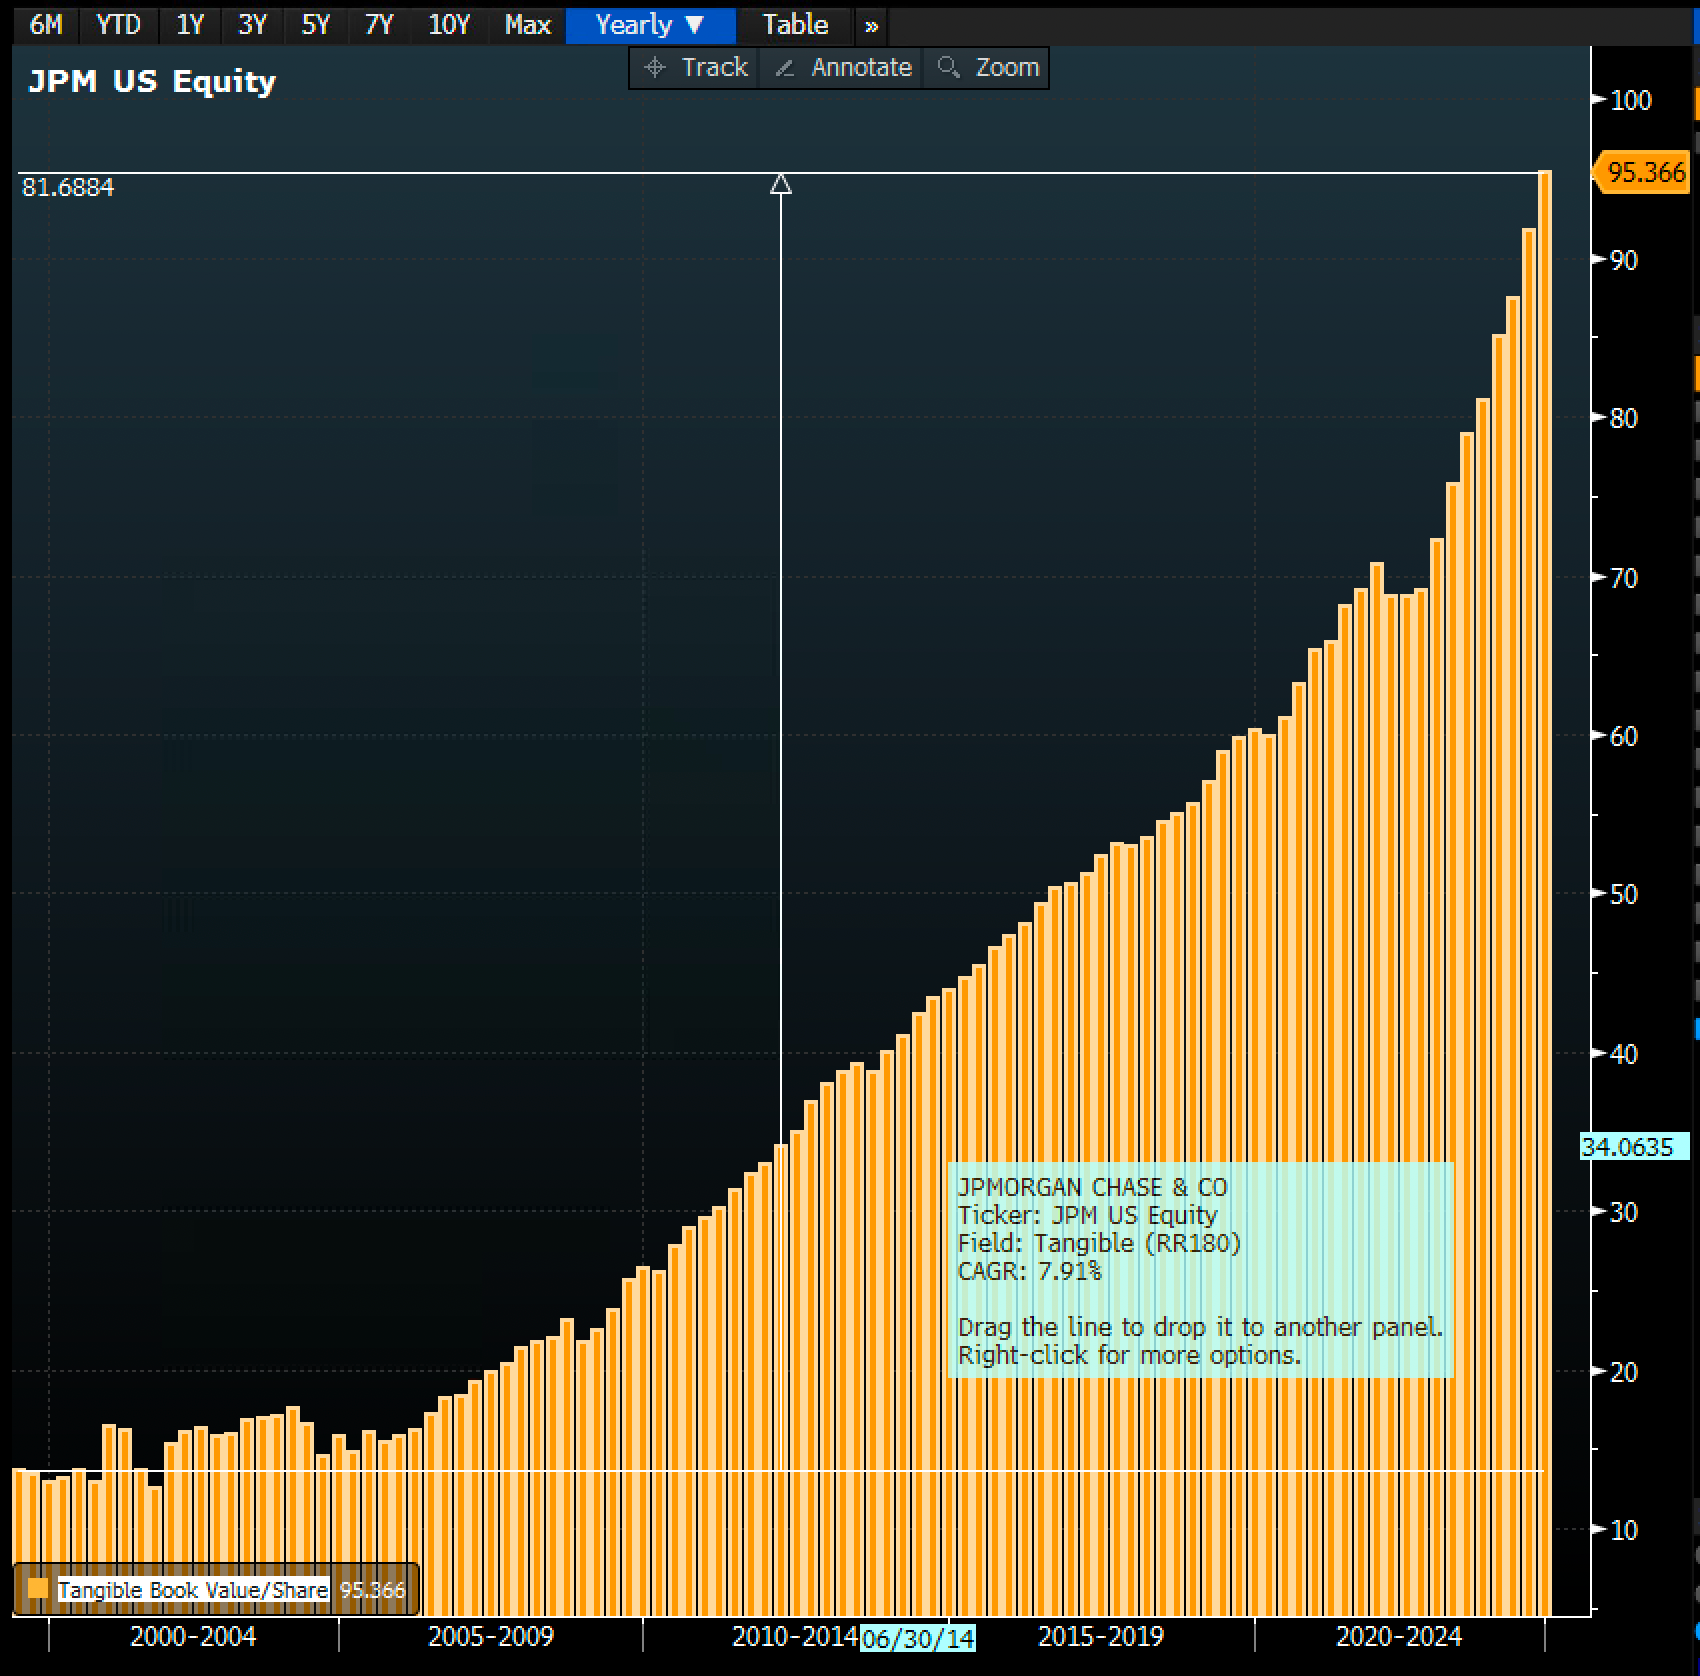
What remains is TBV. In JPM’s case, they have grown TBVPS from around $12 to $95 over the past 24 years for roughly an 8% CAGR. This is best in class.
Market Value & “The Multiple”
Here is where valuation gets interesting. When you look at publicly traded banks, you will often see them trading at a premium or discount to their TBV. The market is saying, “This bank is worth more (or less) than the sum of its parts.”
This is called a multiple, and there is wisdom in this multiple if you know what you are looking for. Are you paying a fair price for a wonderful business? Or a high price for an average business?
What Does A Discount Multiple Mean?
A discount multiple means investors think you are “worth less” (not worthless) than the market. They probably think your forward returns are below your cost of equity capital.
This usually happens when investors are worried about:
The quality of the bank’s assets
Its ability to generate future profits
These companies are typically associated with lower than market returns on tangible common equity and a track record of underperformance.
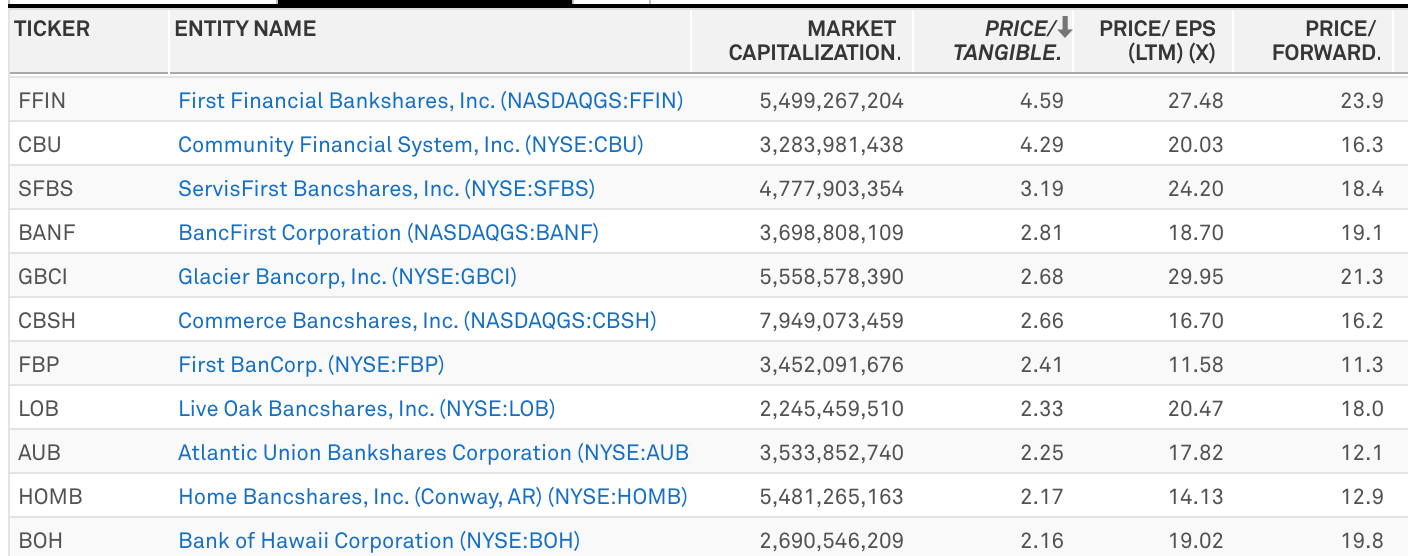
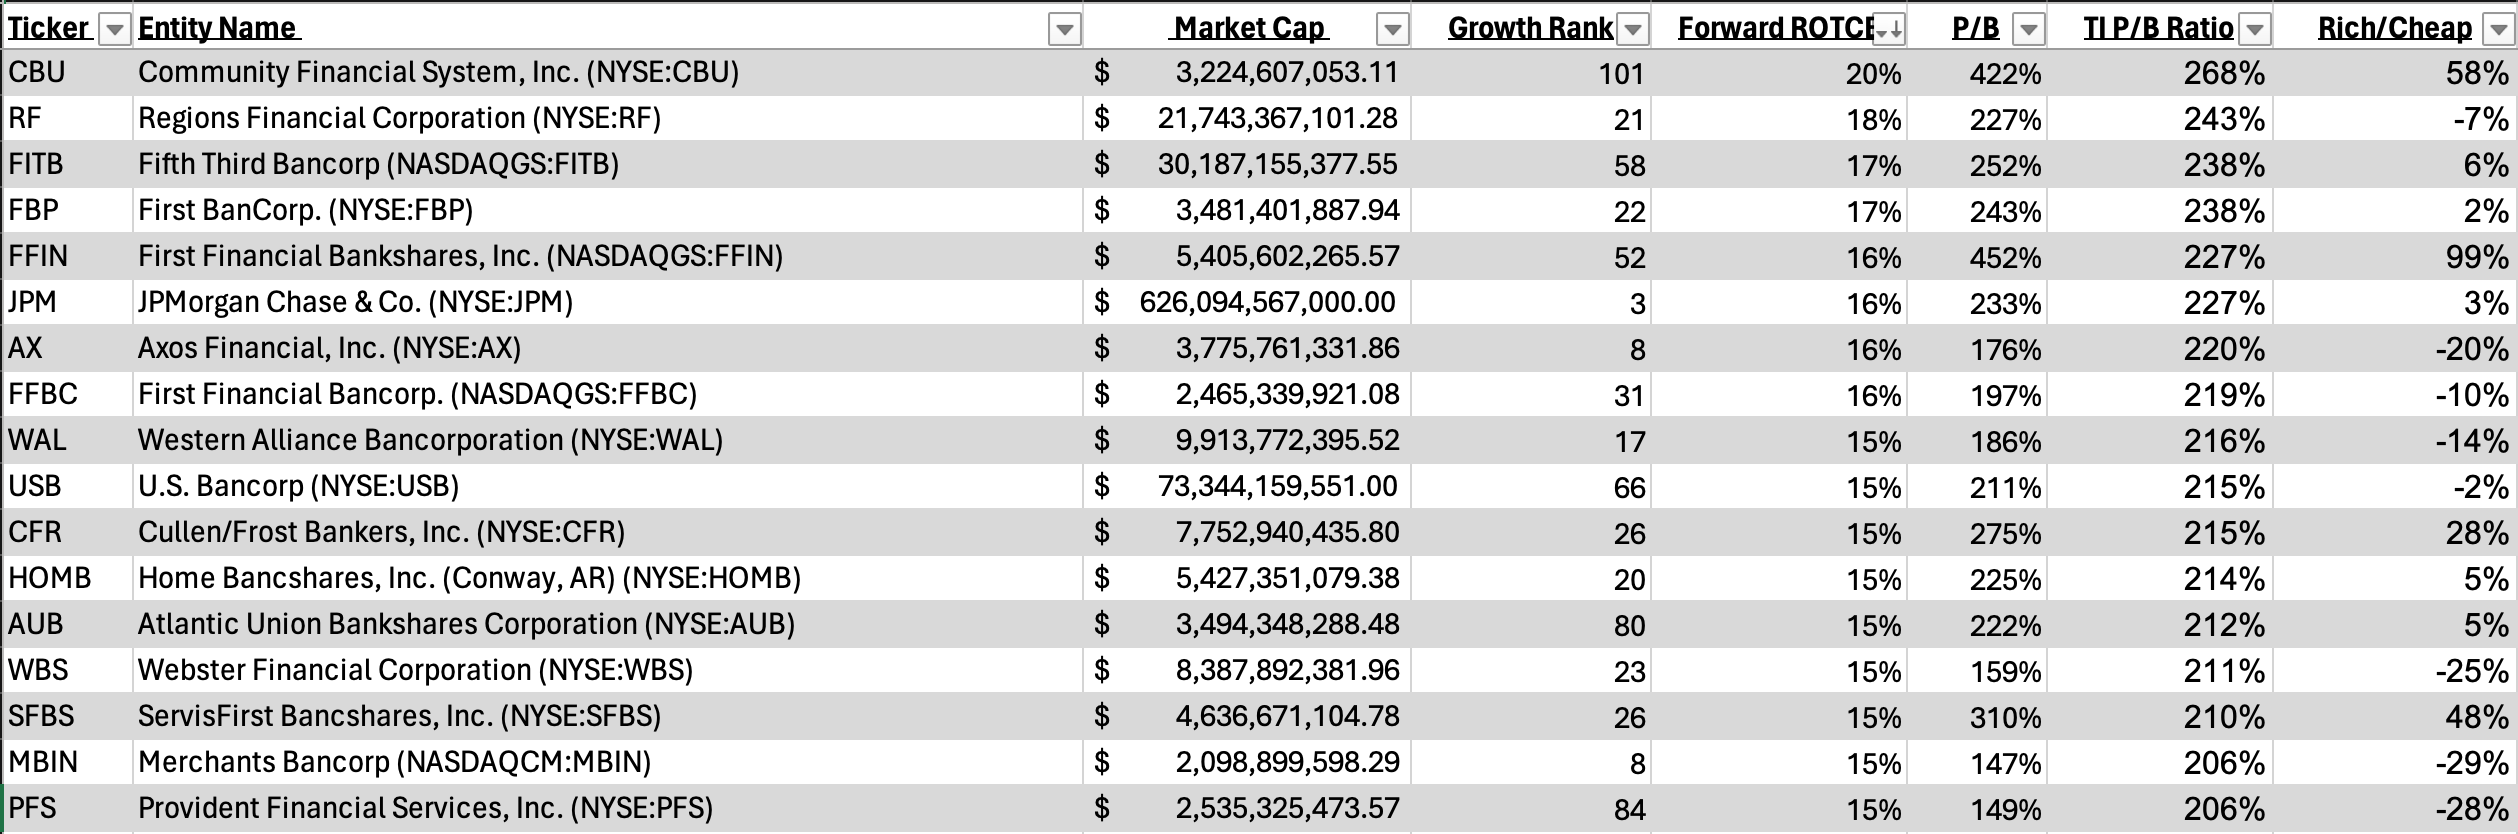
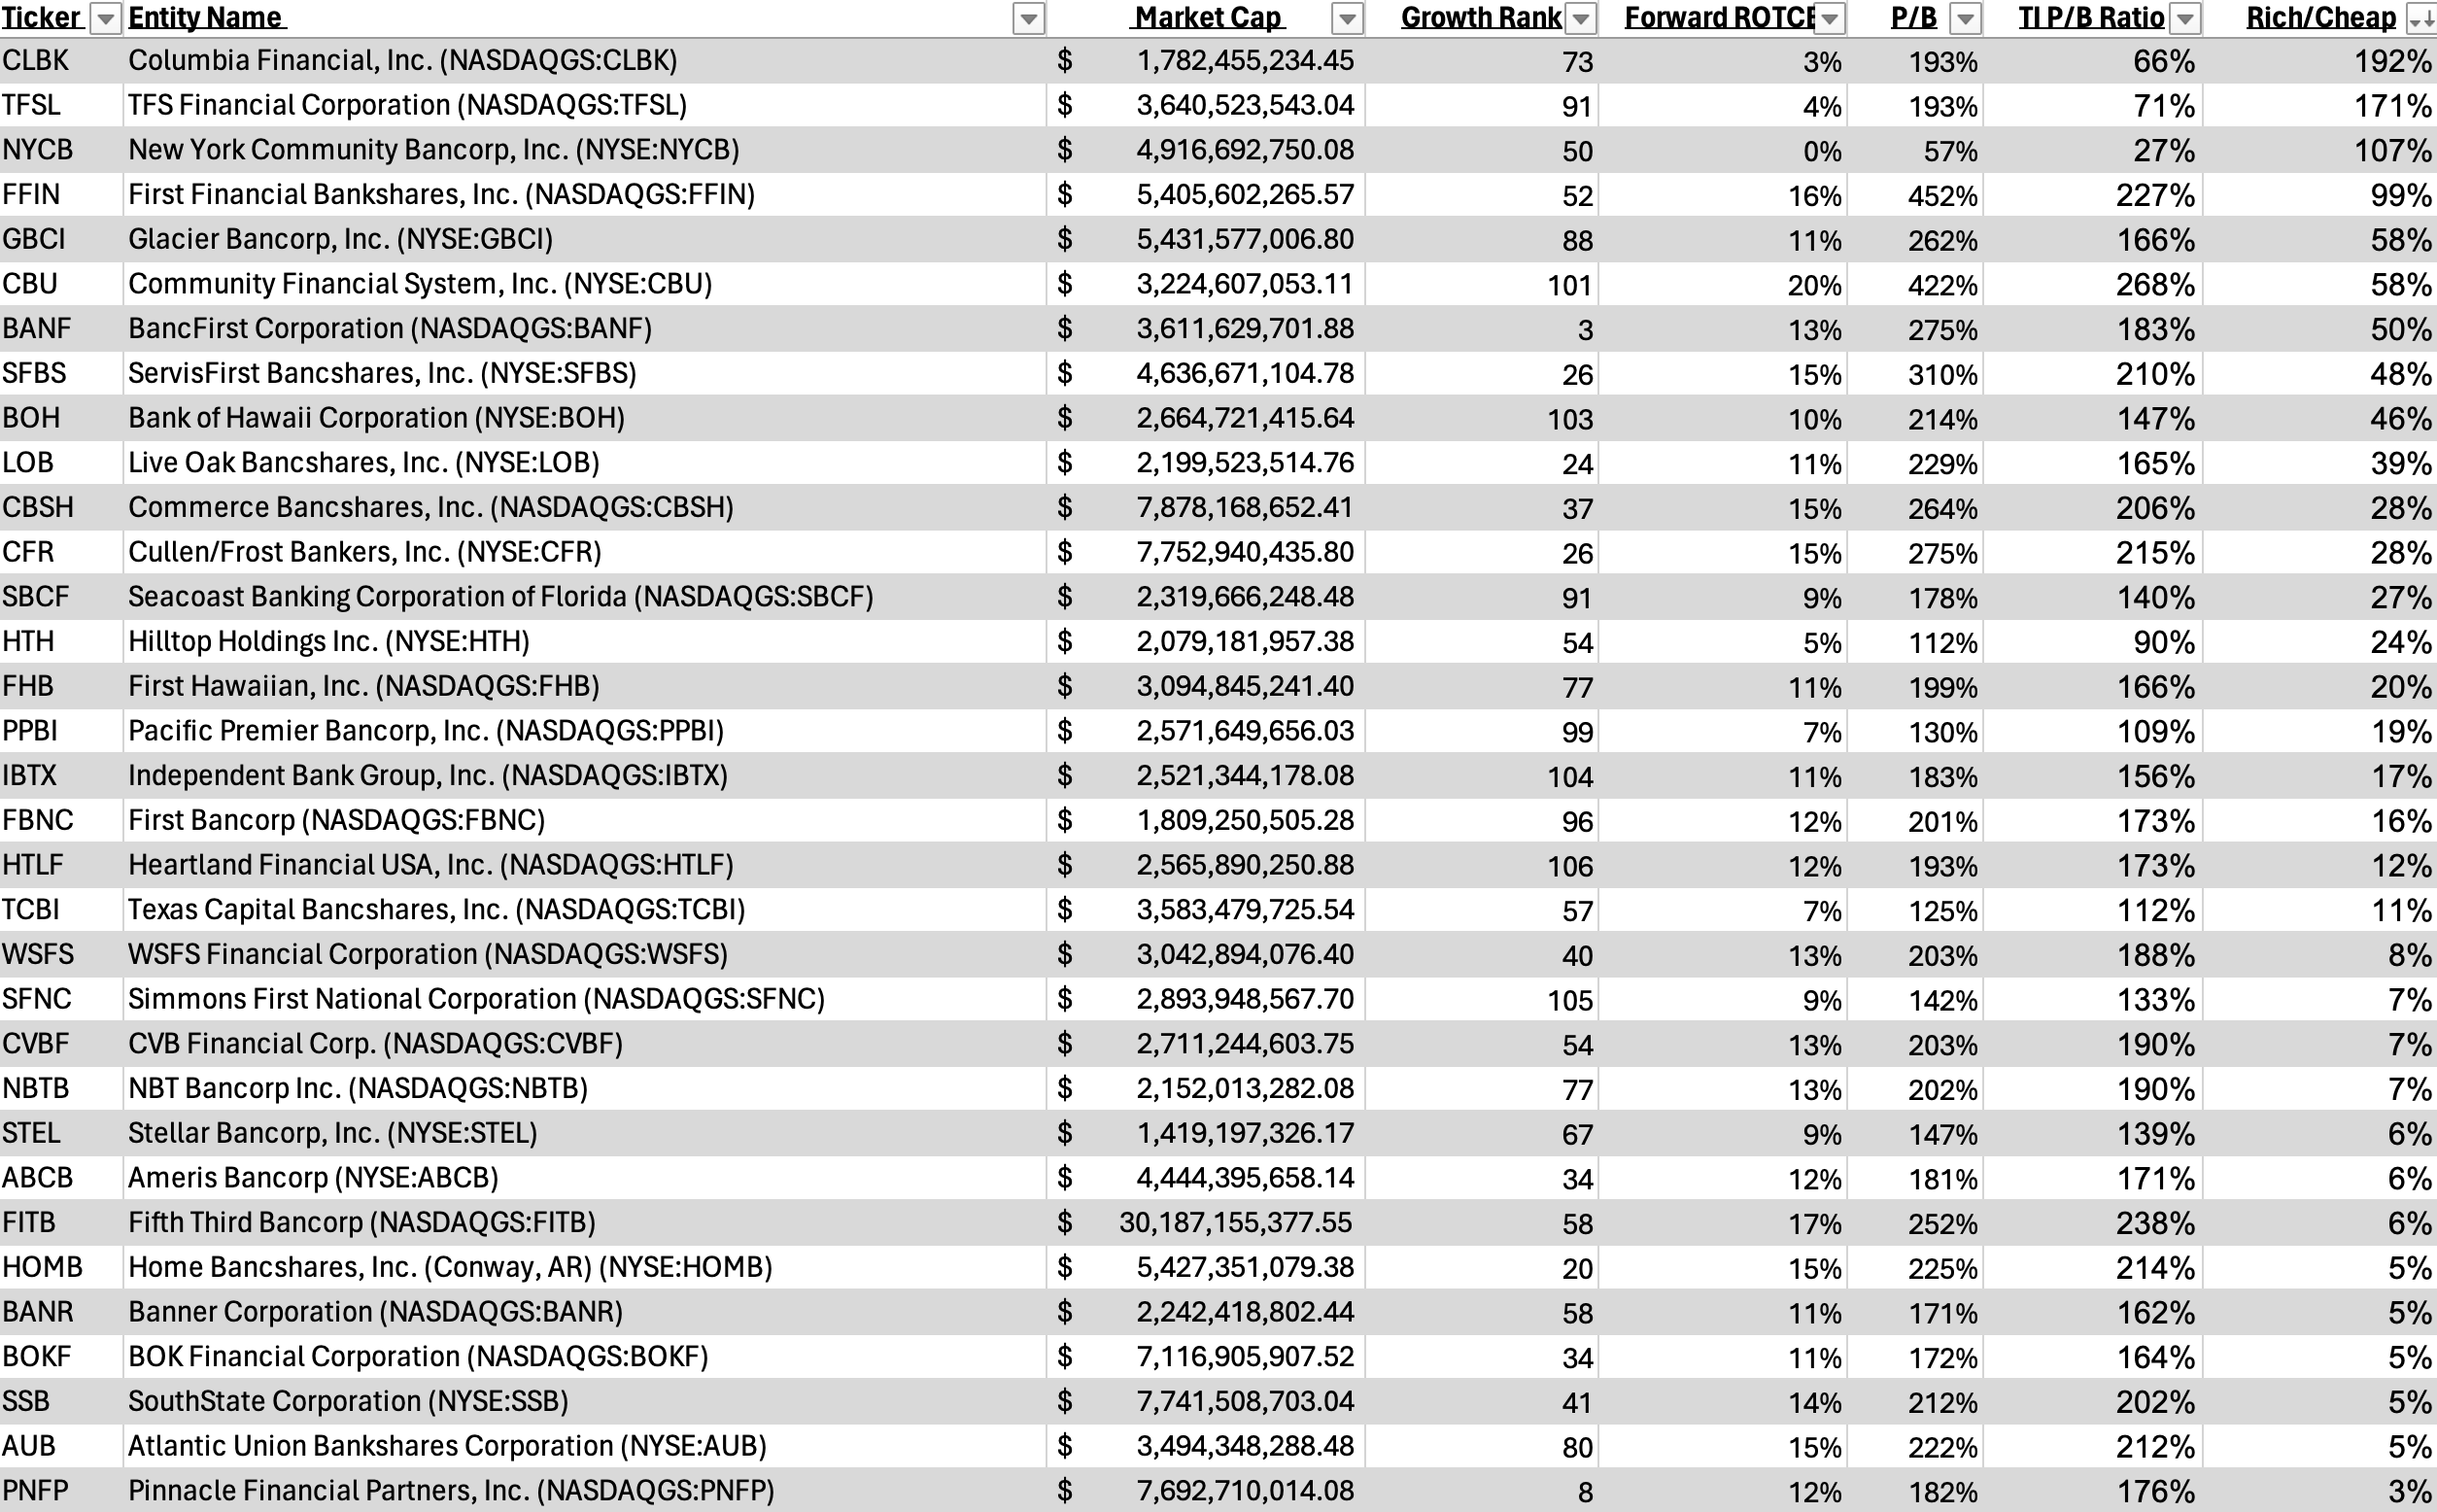
Here are a few expensive regionals based on P/TBV:
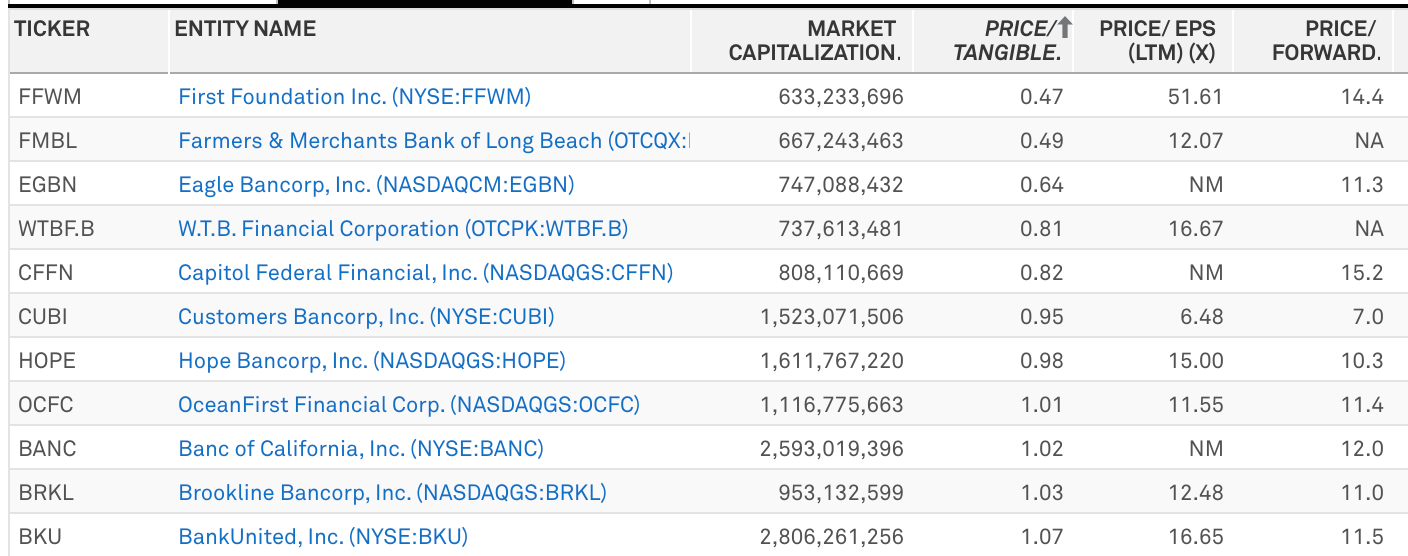
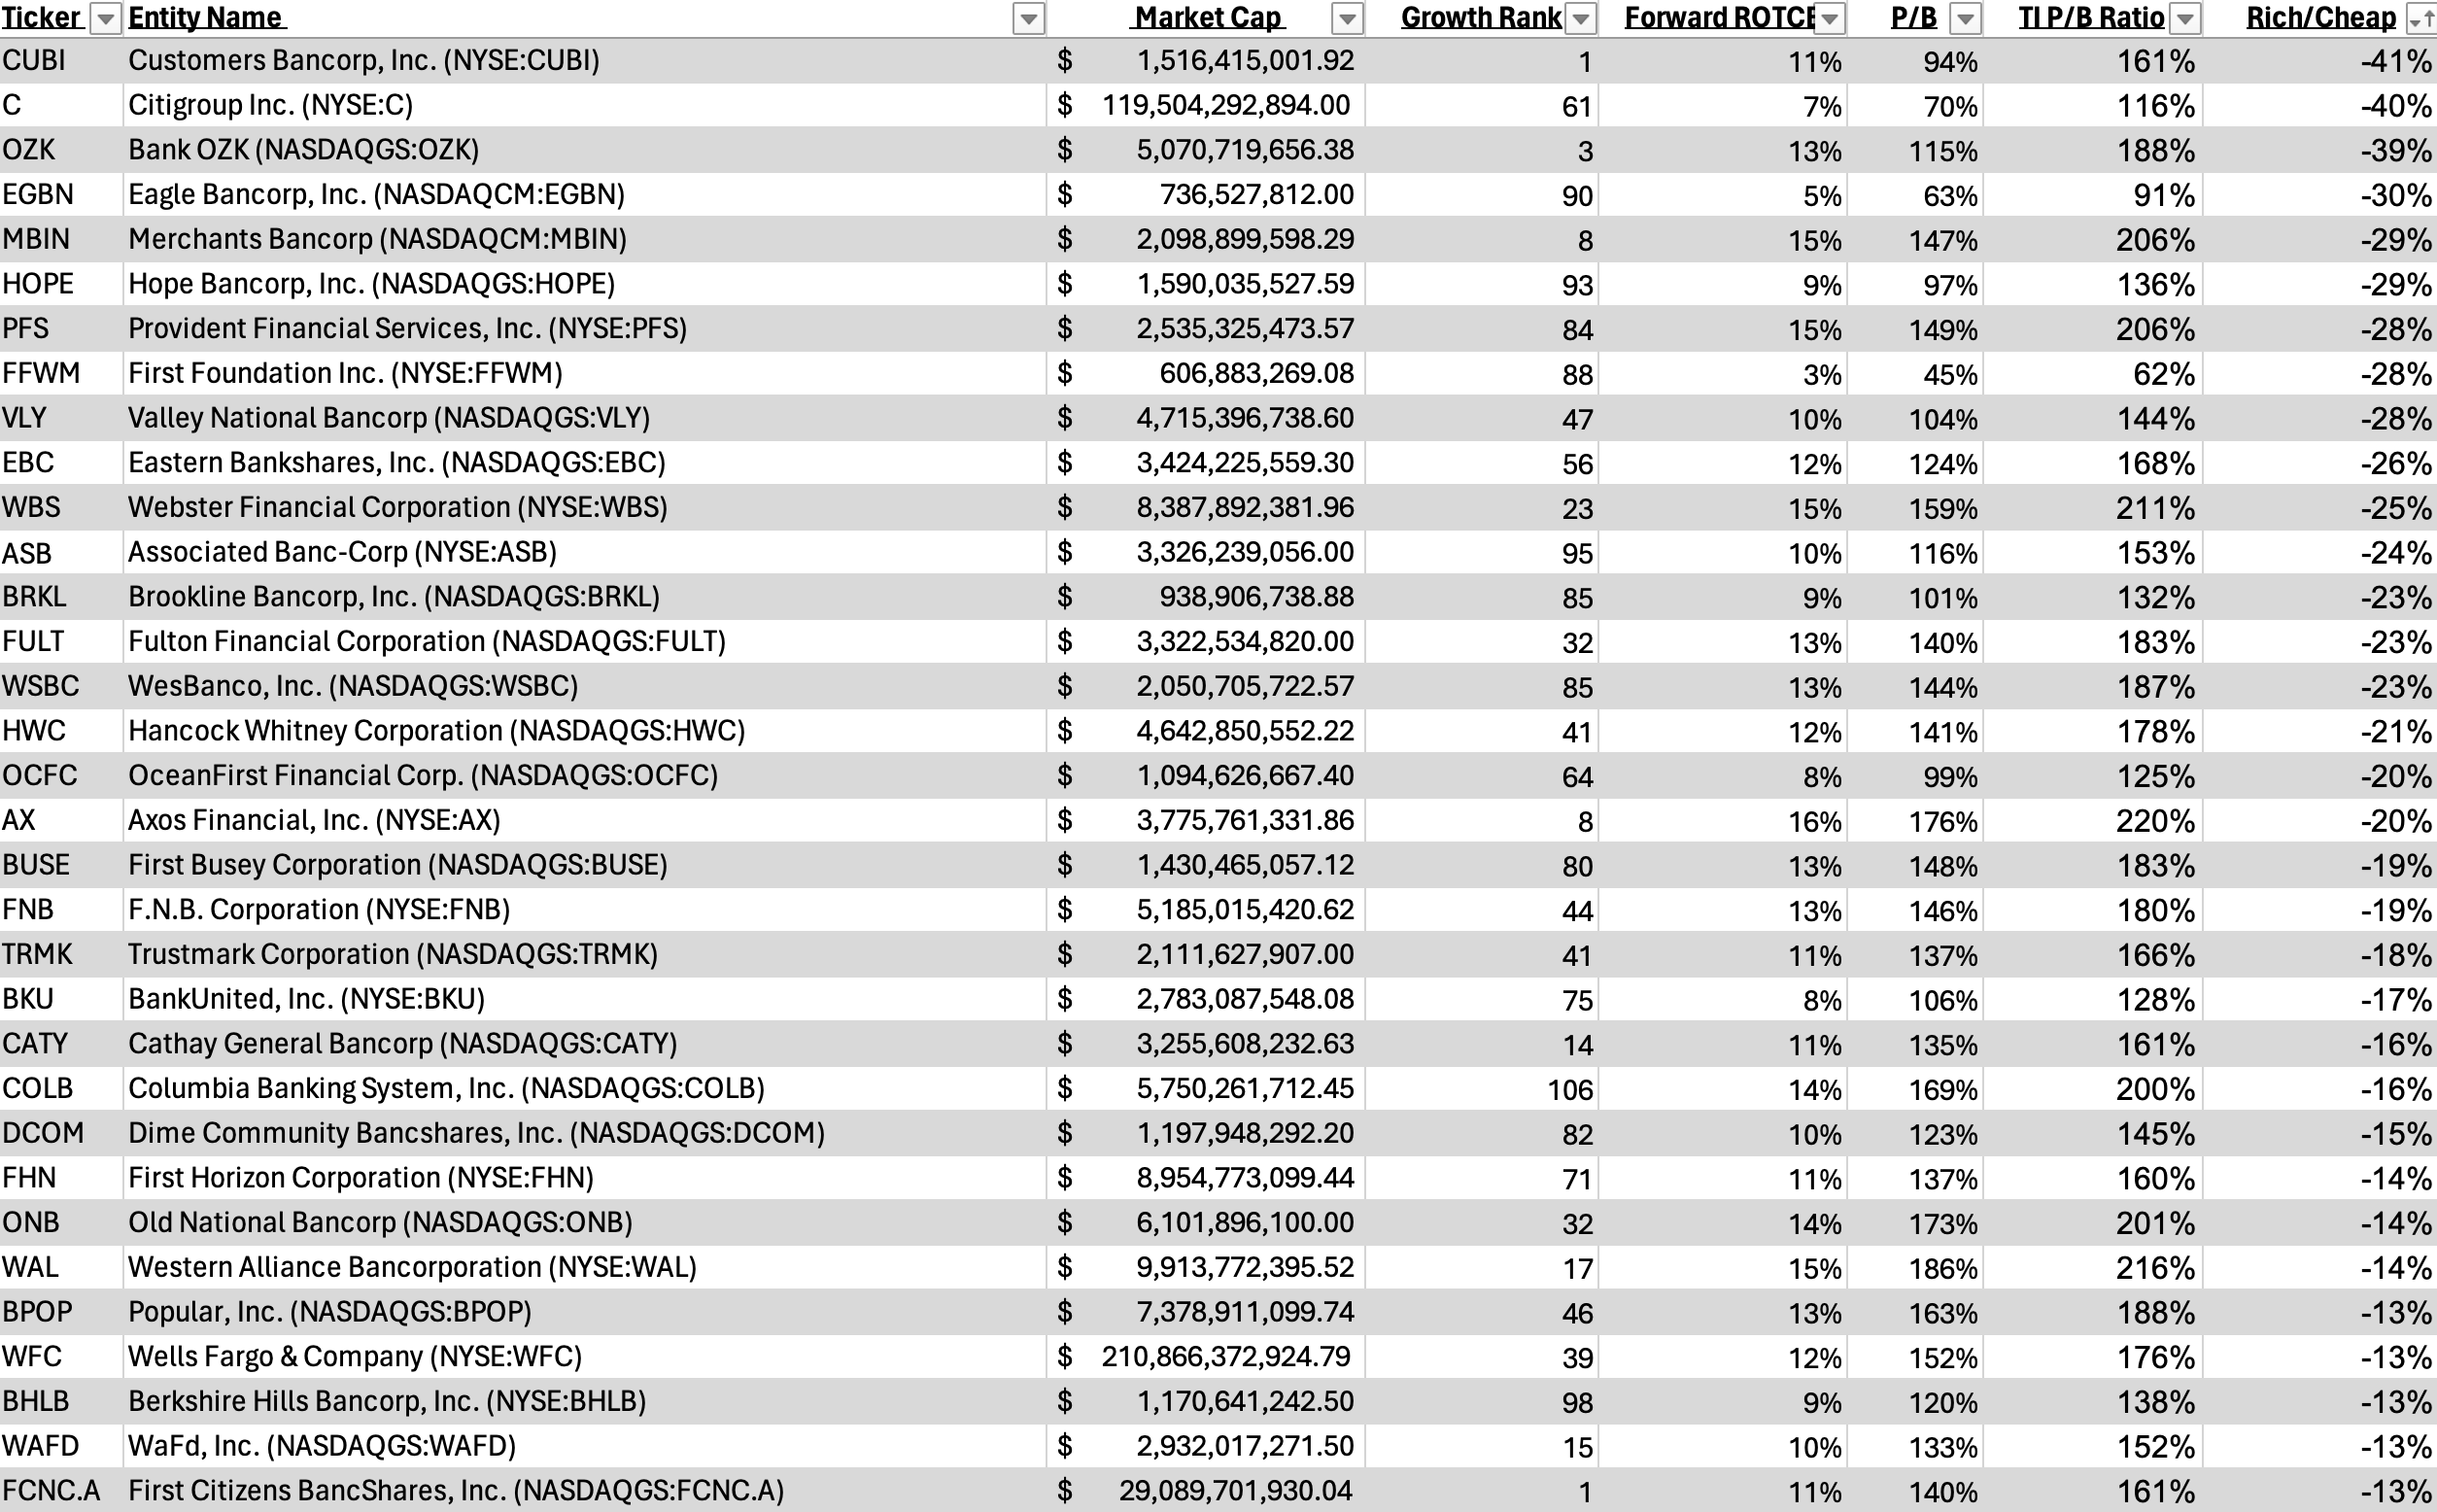
And here are a few cheap regionals based on P/TBV:
What Does A Premium Multiple Mean?
A premium multiple means investors think the bank’s franchise, its ability to generate future profits, and its management are worth significantly more than just its net assets.
Typically, these companies are associated with:
Above market returns on tangible common equity
A track record of doing so over time
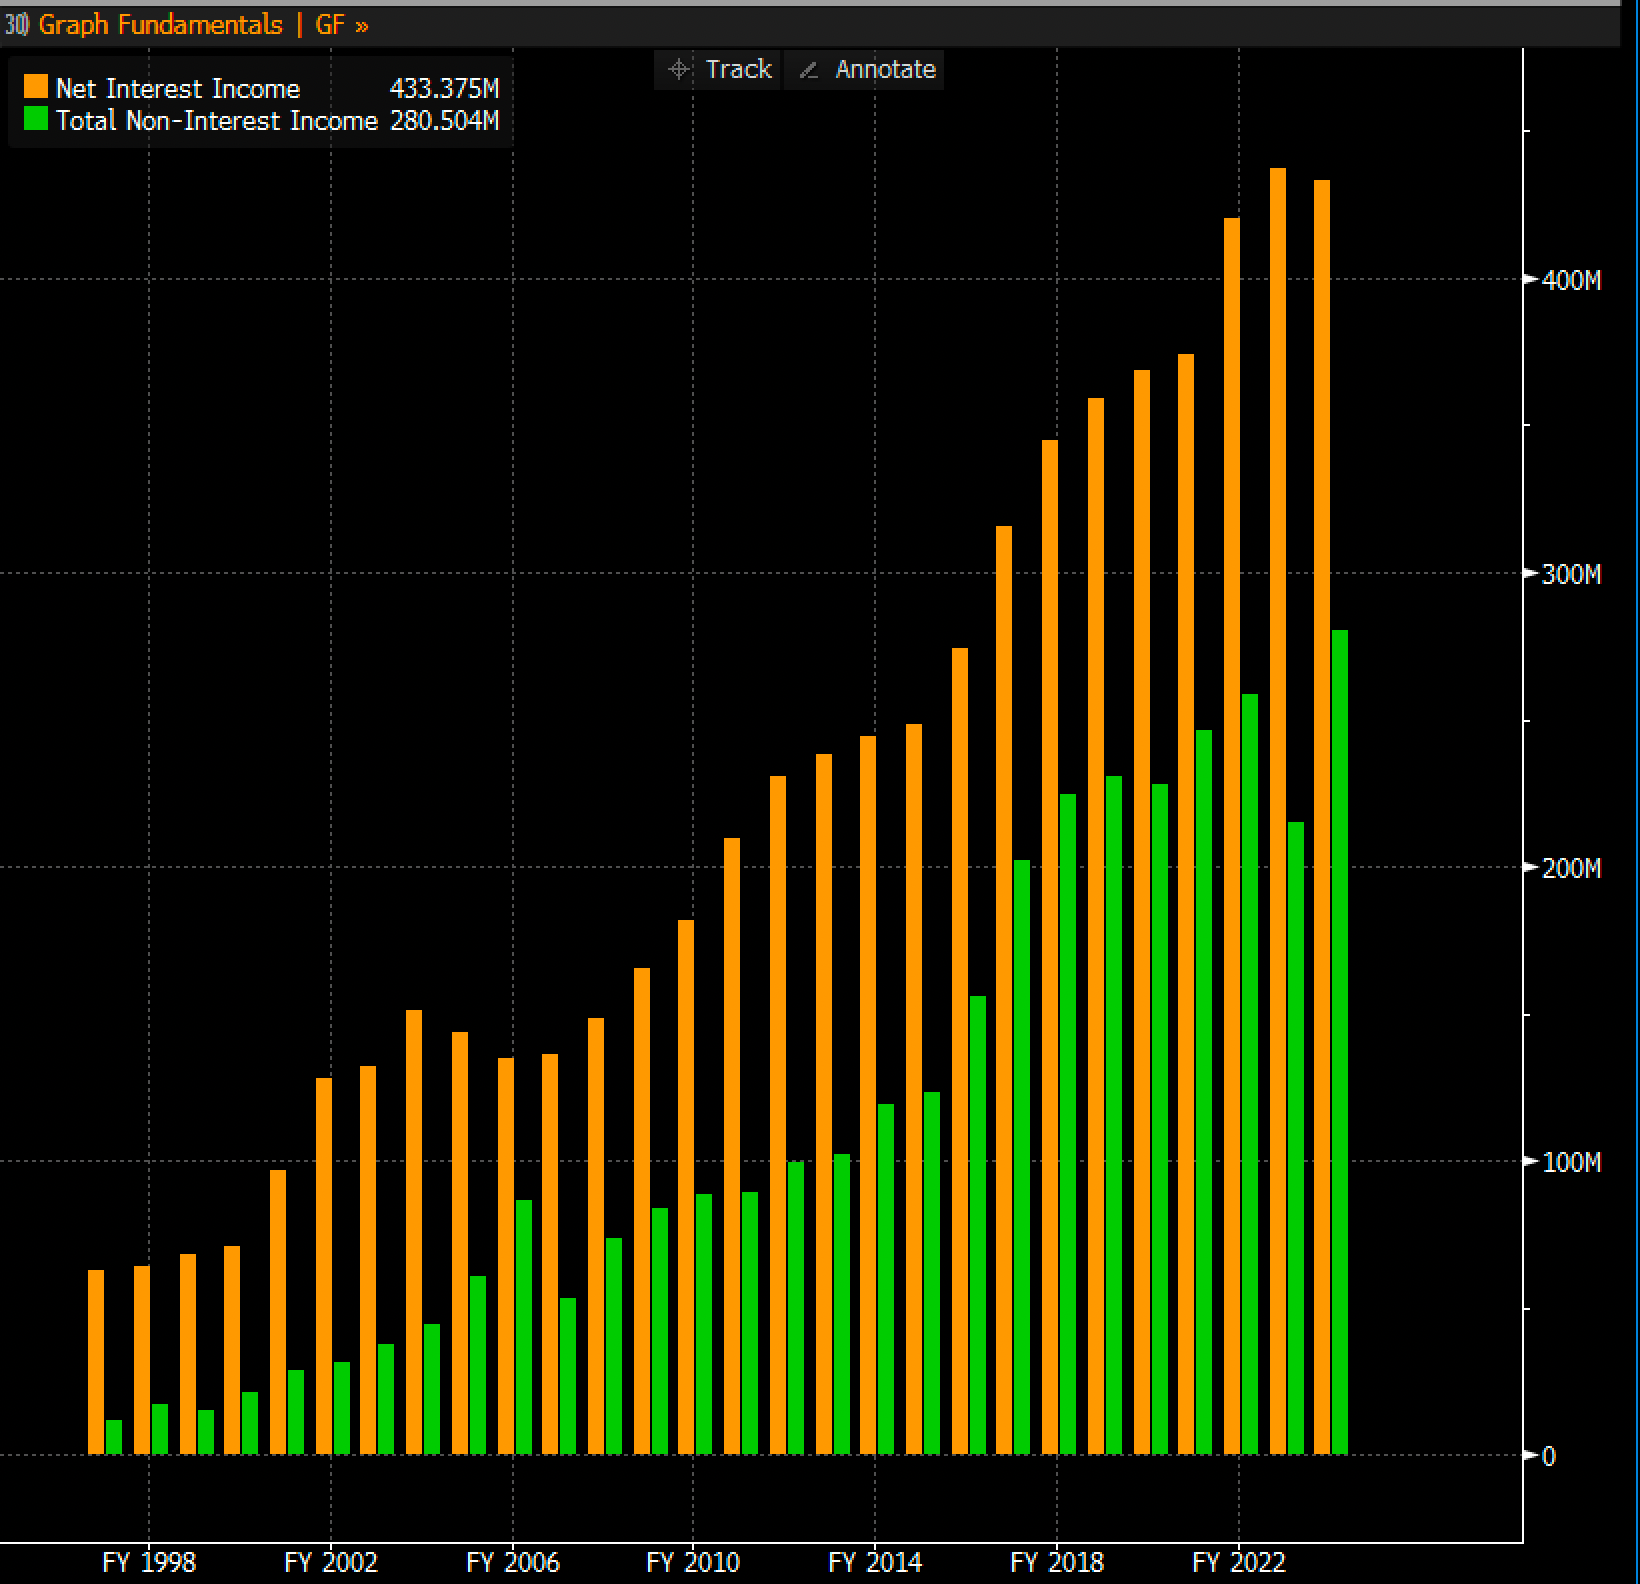
A premium multiple could also mean (like CBU’s case) more income derived from non-bank multiple businesses along with high returns. CBU’s net interest income and non-interest income over time show constant growth. You do not need to listen to management’s words when their actions are this consistent.
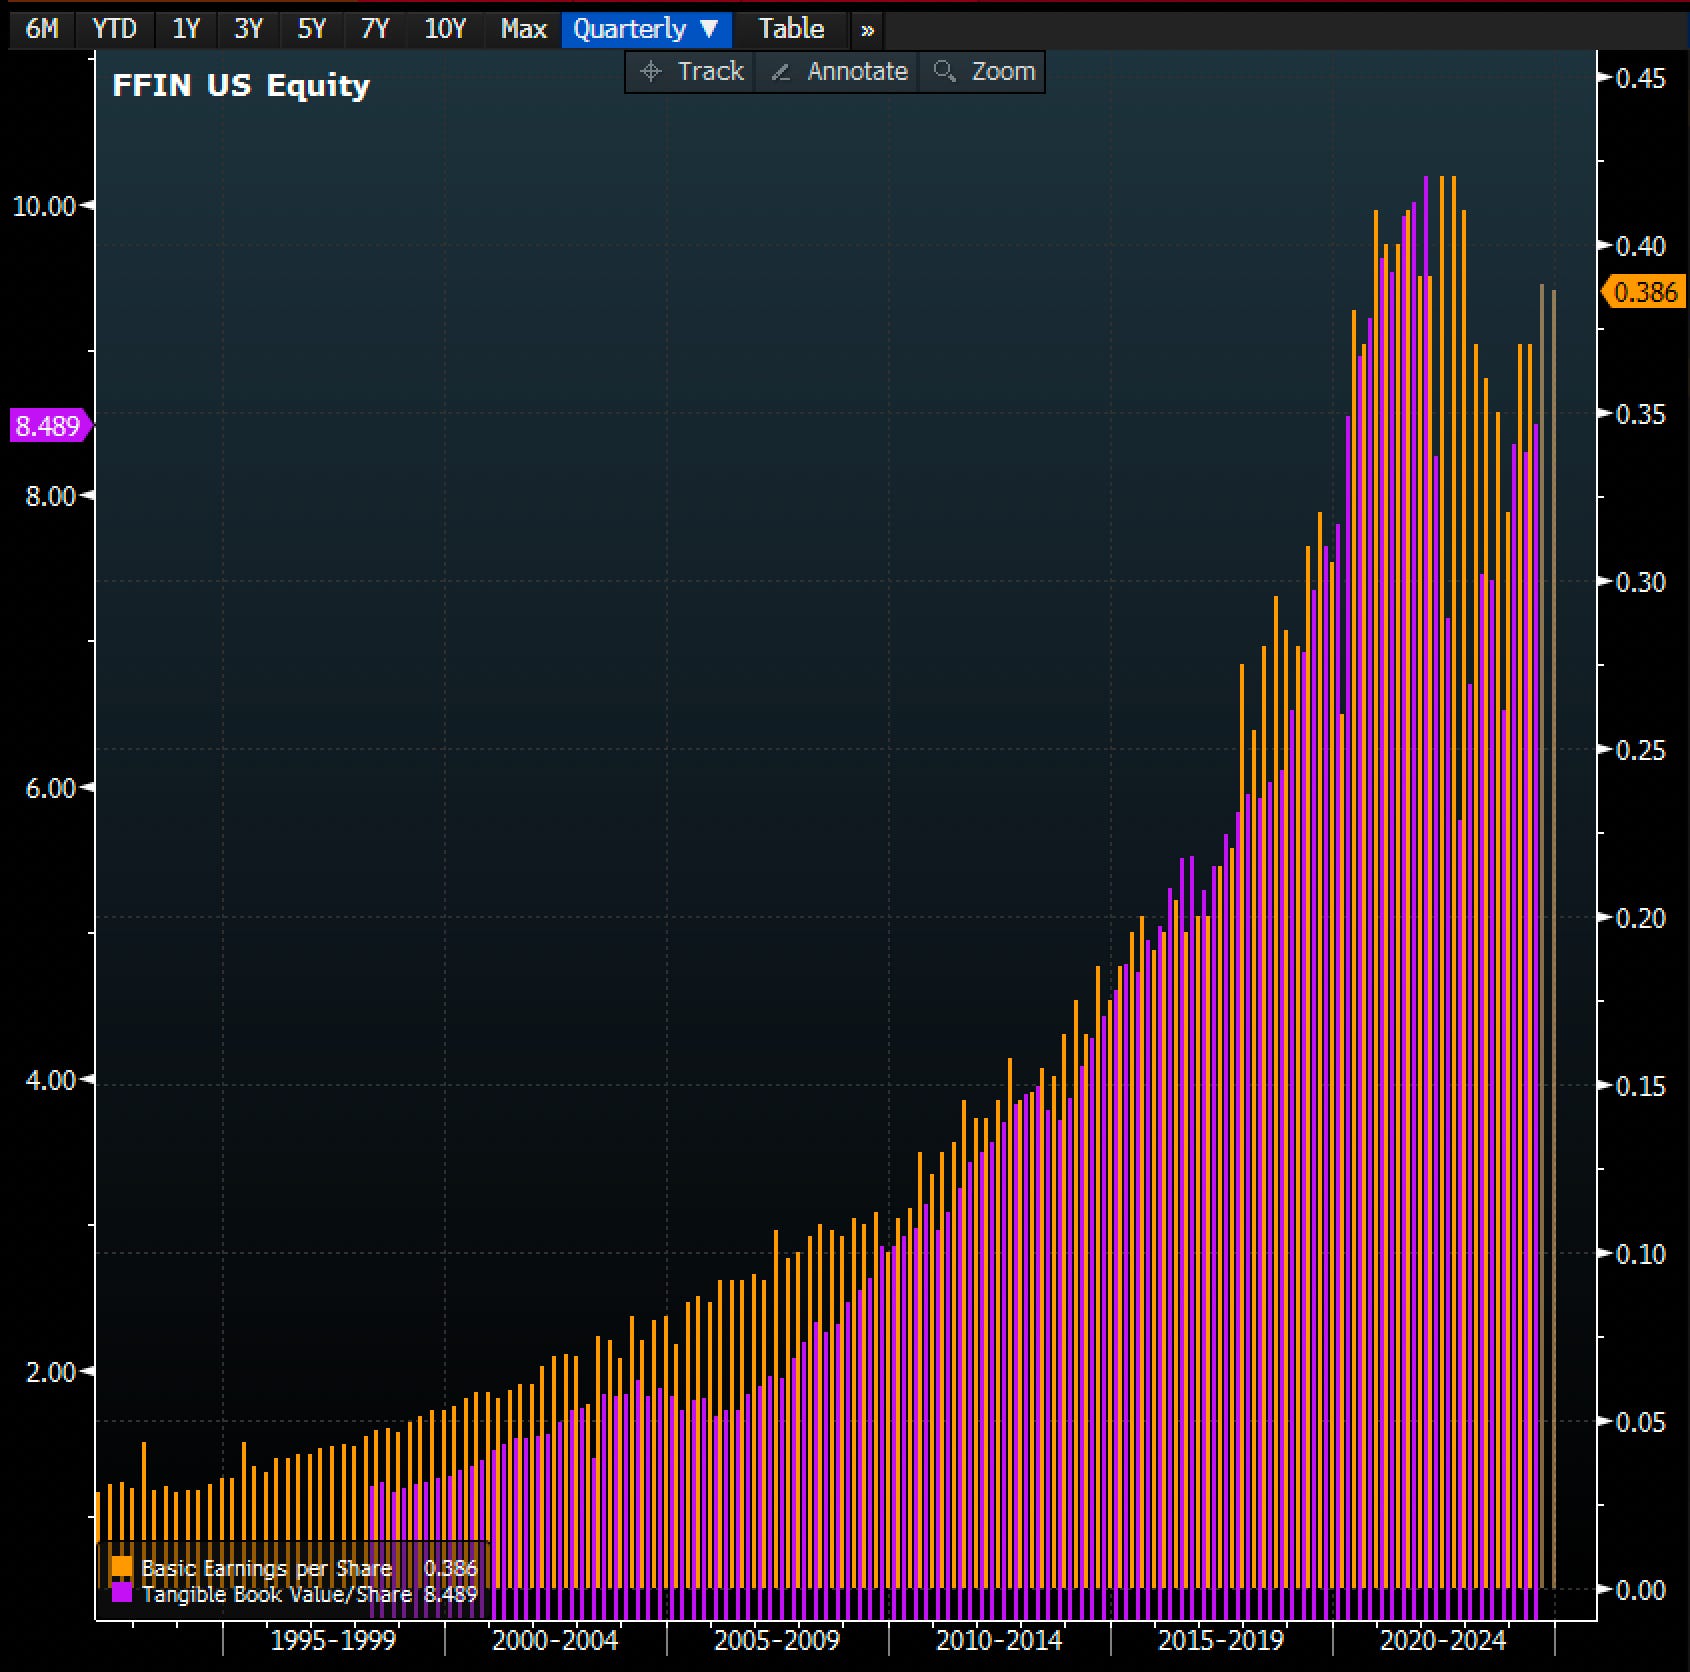
In FFIN’s case, it has an unbelievably long track record of growing EPS and TBVPS for investors. Long track records mean trust. Trust means multiple. Their EPS and TBVPS chart going back to the early 1990s is a thing of beauty. Up until recently, it only went up and to the right. Both have CAGR at just north of 8% a year for 34 years as a public company.
How Does Someone “Value” a Bank? The Big Three Valuation Methods
Wall Street uses three main methods to value banks. Each has strengths and limitations.

1. Discounted Cash Flow (DCF): The Crystal Ball Method
DCF is the theoretical gold standard but impractical for most investors. You estimate all the cash the bank will make in coming years, then figure out what that is worth today via present value.
The key ingredient is the discount rate, often calculated using the Capital Asset Pricing Model (CAPM). It represents the return investors demand for taking on the risk of owning the bank’s stock.
The CAPM Formula: Expected Return = Risk-Free Rate + Beta × (Market Return - Risk-Free Rate)
Where:
Risk-Free Rate is typically the yield on government bonds
Beta measures how much the stock moves compared to the overall market
Market Return is the expected return of the overall stock market
Remember: High discount rates decrease the value of future cash flows, while low discount rates increase the value of future cash flows.
Why DCF Is Problematic For Banks
Aswath Damodaran, the “Dean of Valuation,” says: “A good valuation is a bridge between stories and numbers.”
He emphasizes that while DCF can be powerful, it is only as good as the assumptions you feed into it. Garbage in, garbage out.
Damodaran’s Best Practices For DCF:
Use cash flows, not earnings (for banks this is net income)
Be consistent with growth rates and reinvestment
Do not mix accounting and cash flow numbers
Be careful with terminal values (they often make up a large portion of the valuation)
Here is the rub with banks: their cash flows are weird. Unlike a regular company that makes widgets, a bank’s cash flows are tied up in loans, deposits, and financial instruments.
CFA types may try to force you to use a DCF when valuing banks, but for me it is not practical. Yes, you can build a model, but it is burdensome and almost always wrong, especially if you do not know what you are doing.
This is technically true but practically useless. You are not going to run this when you want to invest in a bank.
To get more insights like this straight to your inbox, subscribe here.
2. Comparable Company Analysis: The “Keeping Up With The Joneses” Approach
This method looks at similar banks and sees how the market prices them. The two big metrics are Price-to-Tangible Book Value (P/TBV) and Price-to-Earnings (P/E).
Understanding P/TBV
P/TBV tells you how much investors are willing to pay for each dollar of a bank’s tangible book value.
P/TBV above 1 means the market thinks the bank is worth more than its net tangible assets
P/TBV below 1 means the market thinks the bank is worth less than its net tangible assets
Understanding P/E
P/E tells you how much investors are willing to pay for each dollar of the bank’s earnings. A higher P/E could mean investors expect higher growth in the future, or it could mean the stock is overvalued.
Michael Mauboussin’s Perspective On P/E
Michael Mauboussin, a valuation guru, says: “P/E multiples are not valuation tools; they are shorthand for the valuation process.”
A P/E ratio is a shortcut. It can give you a quick and dirty estimate, but it does not tell the whole story.
Mauboussin points out that steady-state P/E ratios are closely tied to the cost of capital. The lower the cost of capital, the higher the justified P/E ratio.
His Simple Formula: Steady-state P/E = 1 / (cost of equity - growth rate)
This formula shows why low interest rates can lead to higher P/E ratios: they lower the cost of equity, pushing P/E ratios up.
A company can justify a higher P/E multiple if it consistently earns returns above its cost of equity. When a company’s return on equity exceeds its cost of equity, it indicates efficient capital use. Investors are willing to pay a premium for such companies, resulting in a higher P/E multiple.
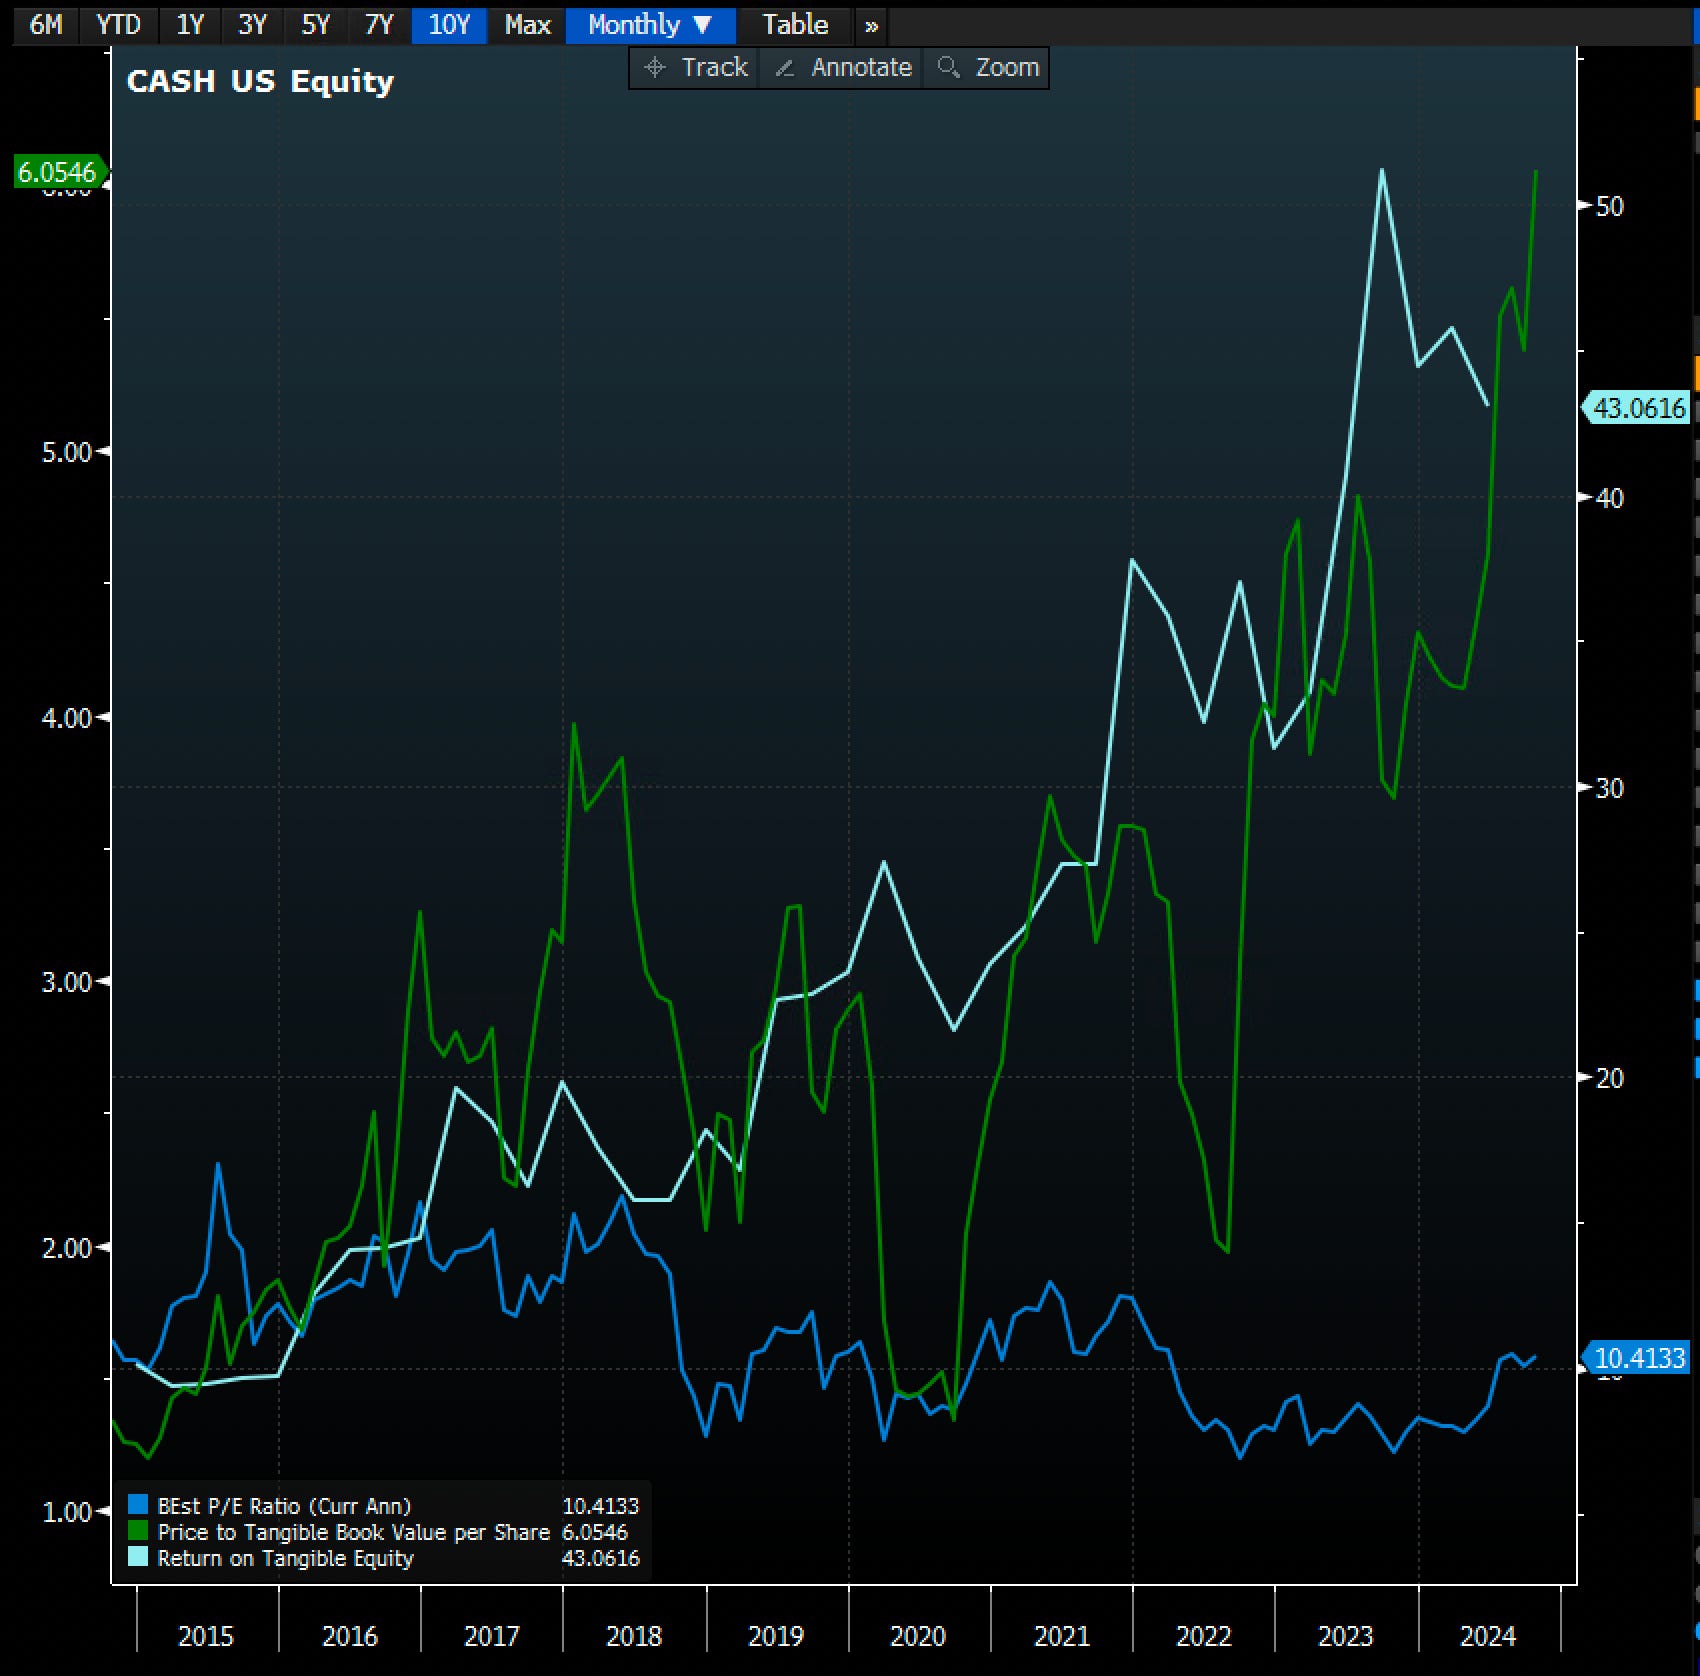
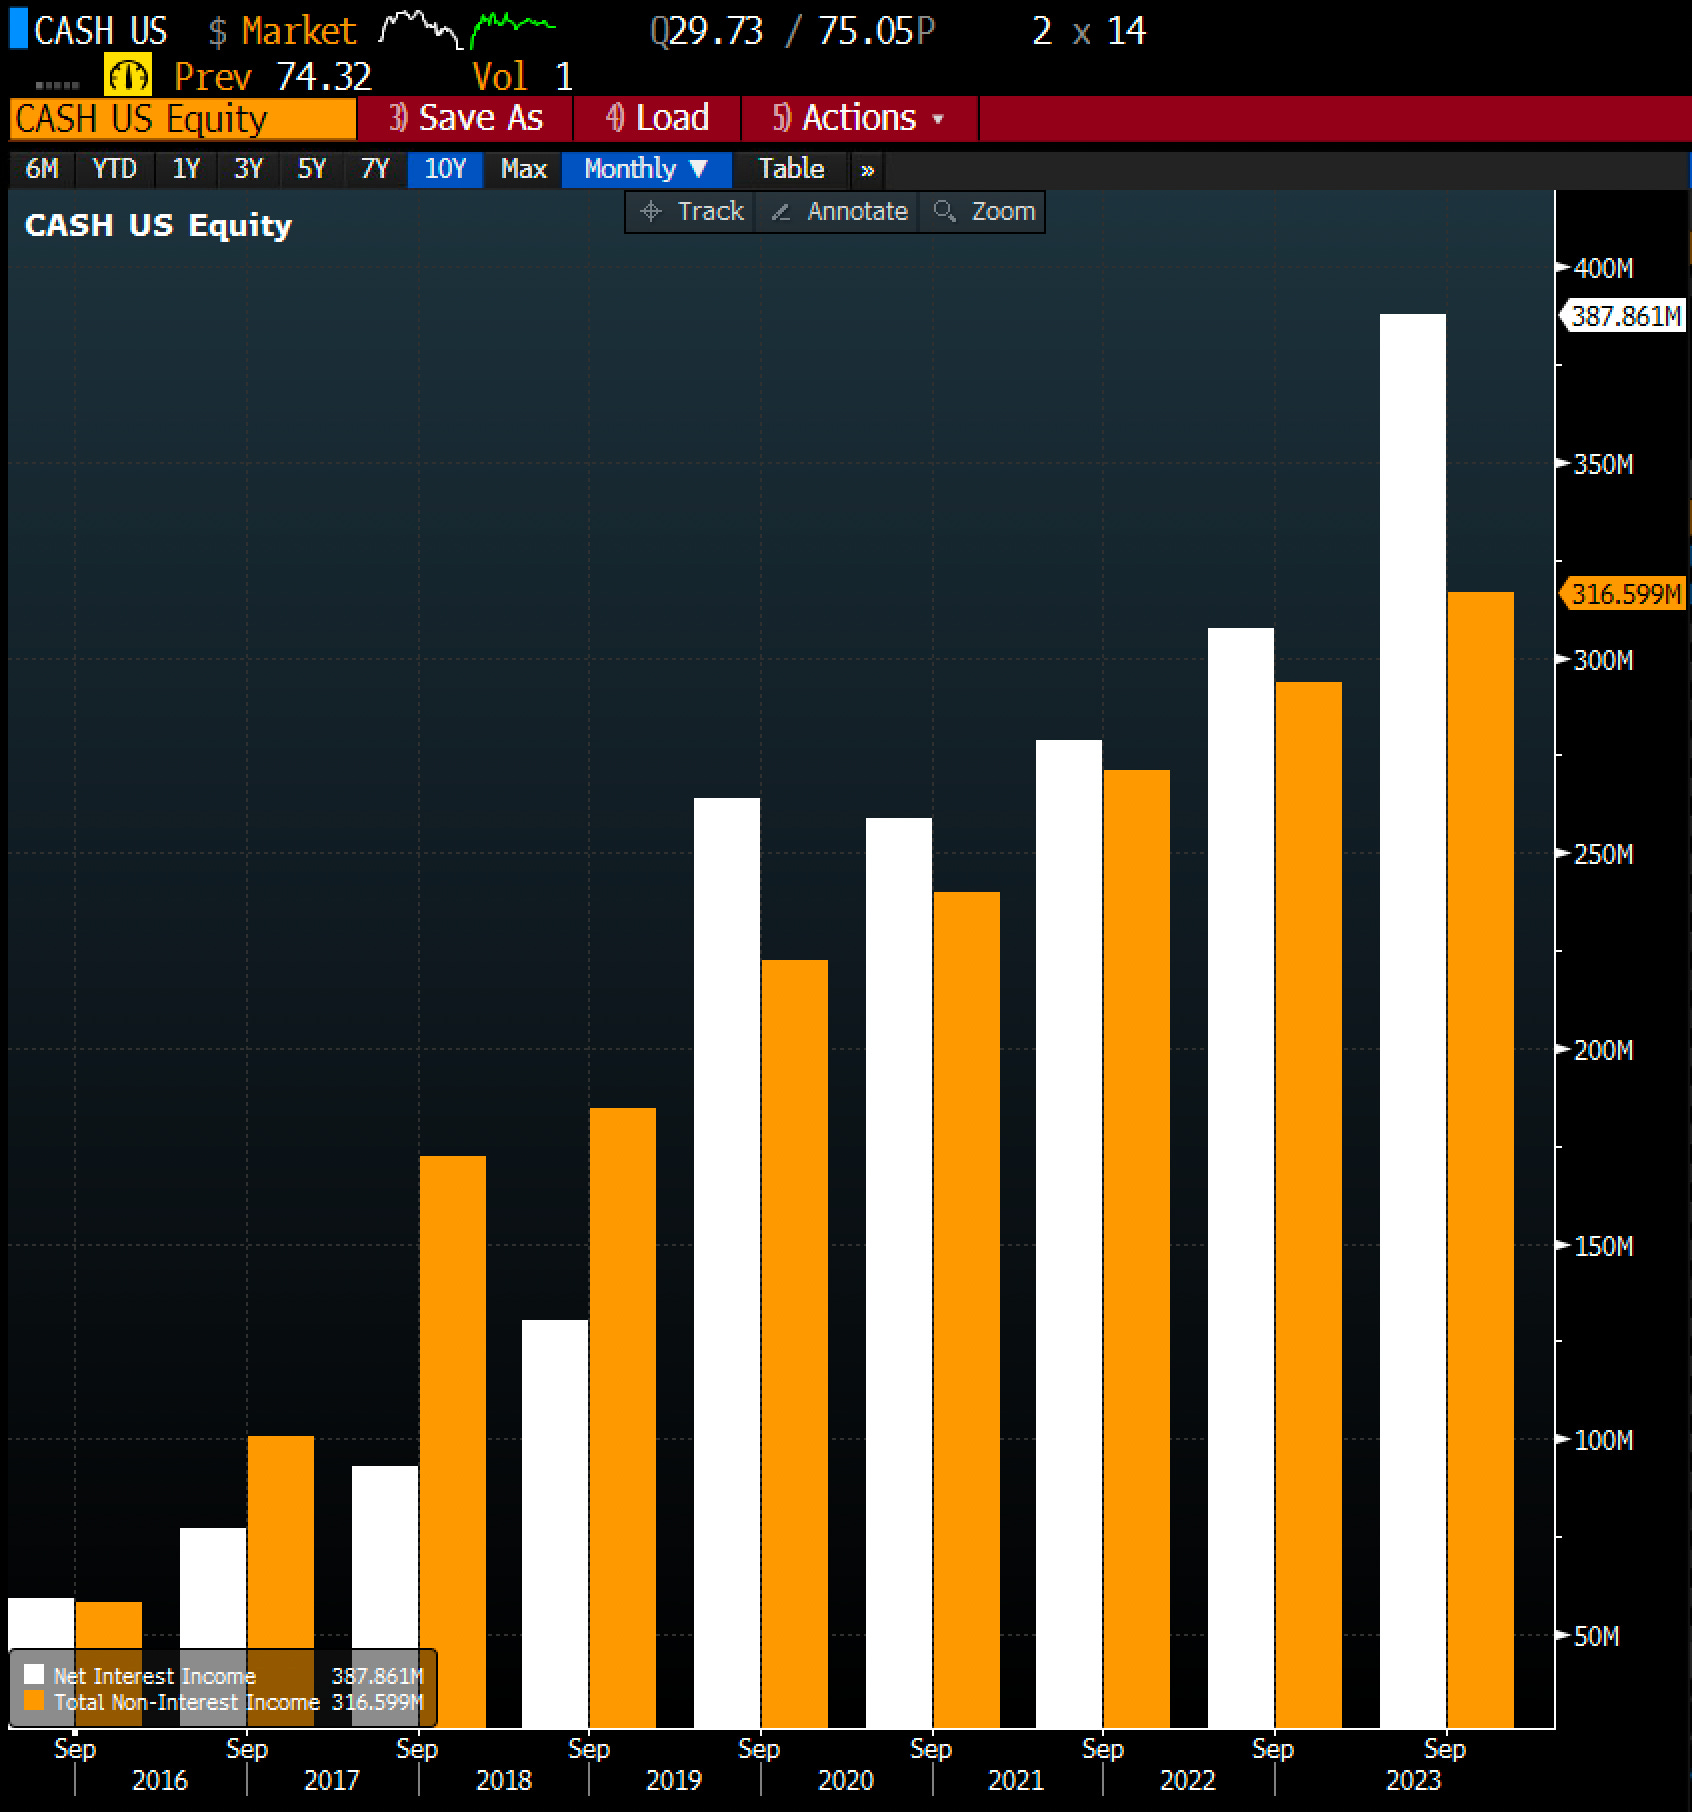
CASH is a great example of this phenomenon in the banking space. The bank is a Fintech/BaaS bank which makes its money very differently than most community banks. It trades at an astoundingly high P/TBV but a reasonable forward P/E multiple at around 11x forwards. Both are justified by their big ROTCEs.
The Earnings Yield Shortcut
The inverse of the P/E ratio is often used as shorthand for the cost of equity. This inverse is known as the earnings yield, calculated as EPS divided by stock price. The earnings yield provides an estimate of the return an investor can expect to earn from the company’s earnings relative to its stock price.
I personally have flippantly (and incorrectly) used this earnings yield as a proxy for the cost of capital. And like many things in life, you should not model all of your behavior after mine, but I digress.
For example:
AAPL’s “cost” of equity is something like 2.8% given its 35x P/E multiple
JPM’s “cost” of equity is something like 8% given its 12x P/E multiple
Not perfect, but you should get the point. For banks overall right now via KRX (Regional Bank Index), the “cost” of equity is also around 8% given its trading around a 12x P/E multiple. If a company within banking is set to earn north of 8-10%, it should have a slight premium multiple.
Deeper analysis of cost of equity will likely take you to a deep dark place you do not want to go, so I tend to leave it at this, know roughly what it is and move on.
The Catch With Bank Multiples
There is a catch with using multiples for banks: they can be as misleading as a politician’s promise. Banks can juice their earnings through aggressive lending or accounting tricks, making their P/E look artificially low.
When Using Comparable Company Analysis, Consider:
Asset quality: How are NPLs? How are NCOs? Do they do non-recourse CBD office? Do they do low LTV resi?
Loan portfolio composition: Are they concentrated in one industry or one geography? Are they over-levered to a binary outcome? TFIN comes to mind with respect to trucking concentration.
Funding mix: Do they rely on short CDs like most thrifts in the country? Or do they have a bunch of low-cost business checking accounts?
Regulatory environment: Are their CET1 ratios or concentrations causing regulatory scrutiny?
These factors explain why seemingly similar banks trade at different multiples. And they should.
Returns On TCE And Market Multiple
The relationship between Price-to-Tangible Book Value (P/TBV) and Return on Tangible Common Equity (ROTCE) is significant. Generally, banks with higher ROTCE tend to have higher P/TBV ratios.
This is because ROTCE is a measure of a bank’s profitability, and higher profitability often leads to higher valuations. Investors are willing to pay a premium for banks that generate strong returns on their tangible equity, which drives up the P/TBV ratio.
Studies have shown a positive correlation between ROTCE and P/TBV, indicating that as ROTCE increases, so does the P/TBV multiple. This relationship underscores the importance of profitability in determining a bank’s valuation.
When evaluating banks, it is crucial to consider both ROTCE and P/TBV to get a comprehensive understanding of their financial health and market valuation.
I run these screens regularly to see the relationship between the two different variables. This below is for all public banks above $10 billion in assets. What do you notice? I see a correlation (not causation).
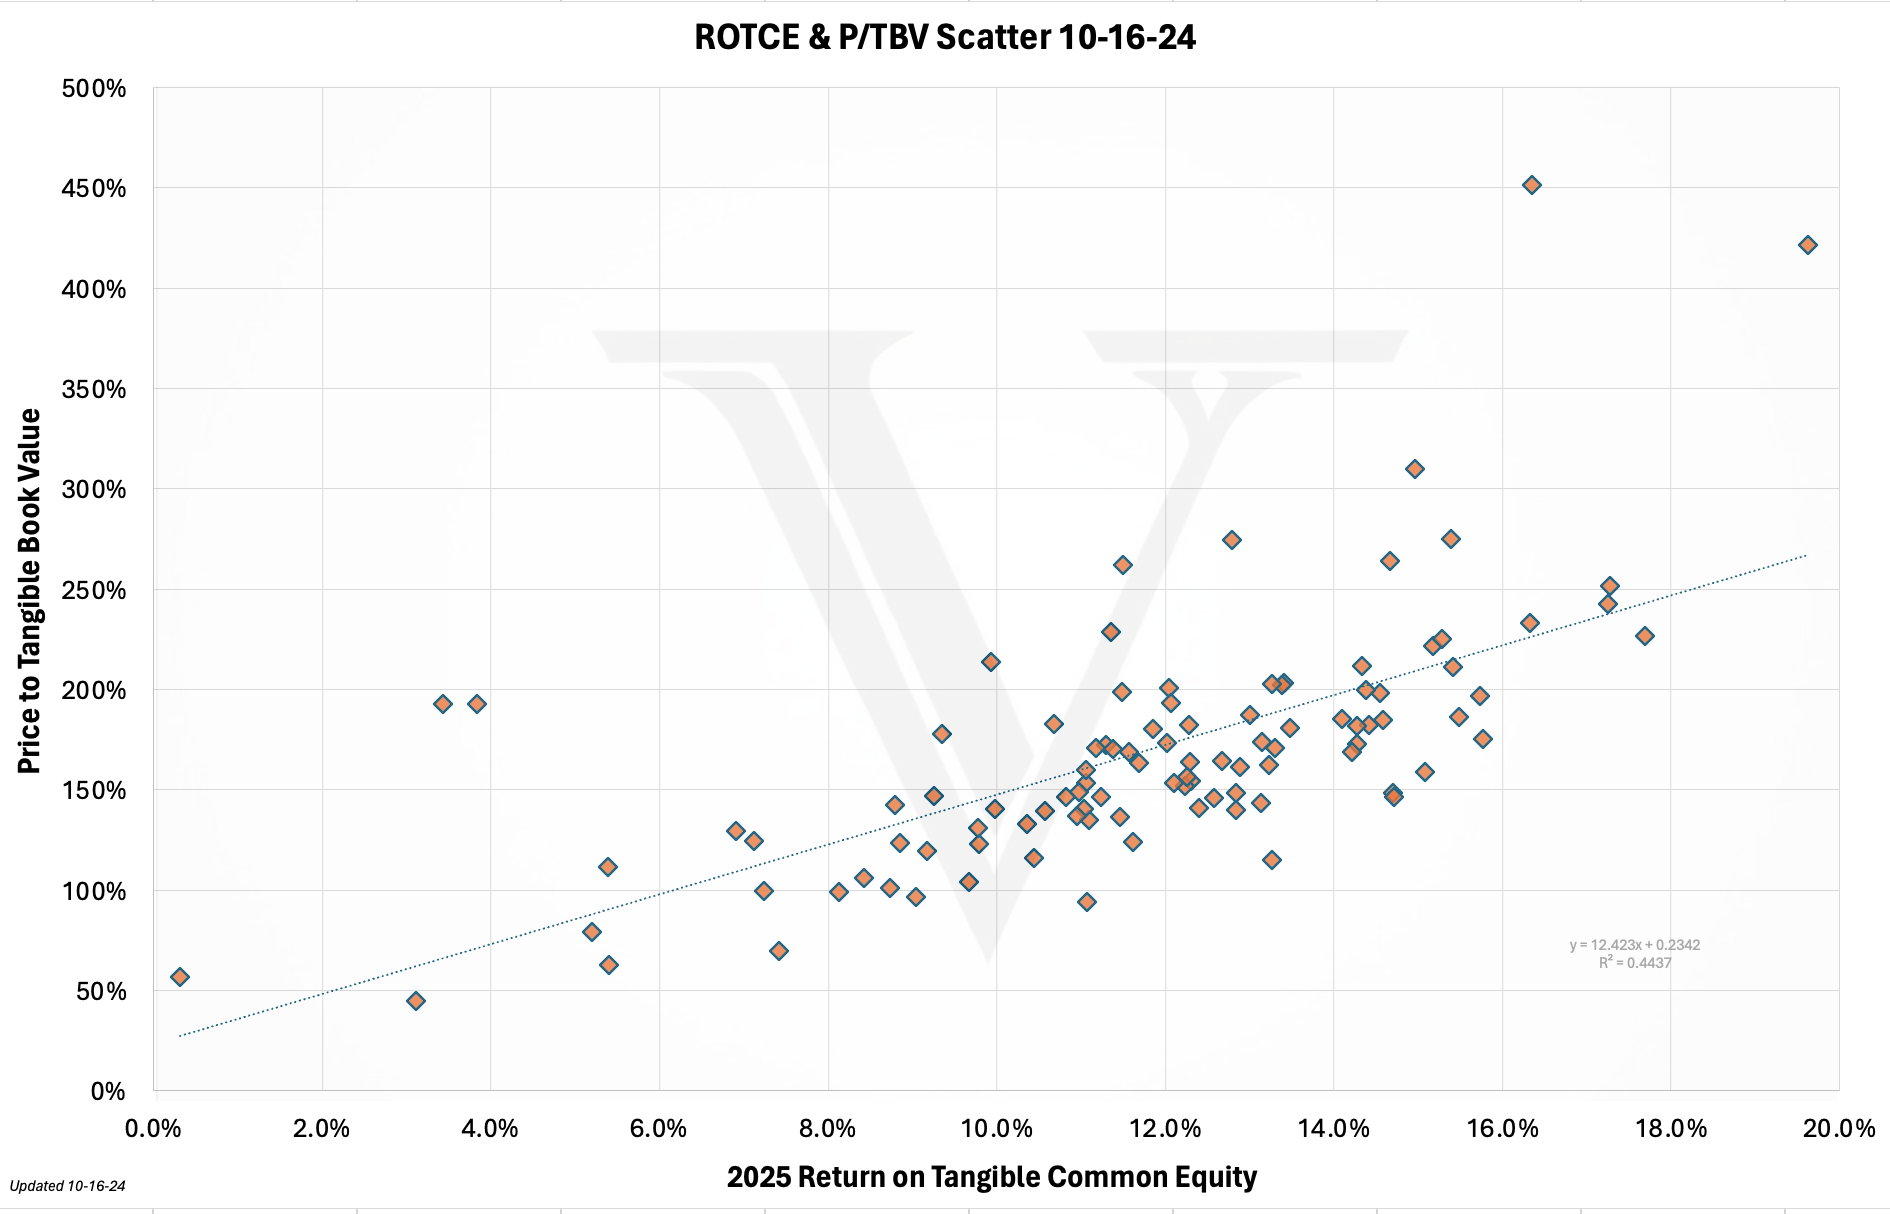
What The Data Shows
I run these screens regularly to see the relationship between the two variables. For all public banks above $10 billion in assets, you notice a correlation (not causation).
These screens shed light on why a name trades cheap or expensive to trend:
A bank like WBS or PFS trades cheap to their otherwise implied ROTCE valuation because they have a lot of CRE (among other things). Given uncertainty around future commercial real estate credit, investors discount valuations.
Banks like FFIN sport mega premium valuations, largely because they are unbelievably consistent at pumping out returns.
Growing Earnings And Market Multiple
Investors are willing to pay a higher P/E ratio for banks that consistently grow earnings because it signals strong future growth potential and financial stability.
When a bank demonstrates consistent earnings growth, it indicates effective operations management, market presence expansion, and higher profit generation. This instills confidence that the bank will continue to perform well in the future.
Higher earnings growth also means the bank can:
Reinvest profits into new opportunities
Pay dividends
Buy back shares
All of which can enhance shareholder value. As a result, investors are willing to pay a premium for such banks, reflected in a higher P/E ratio.
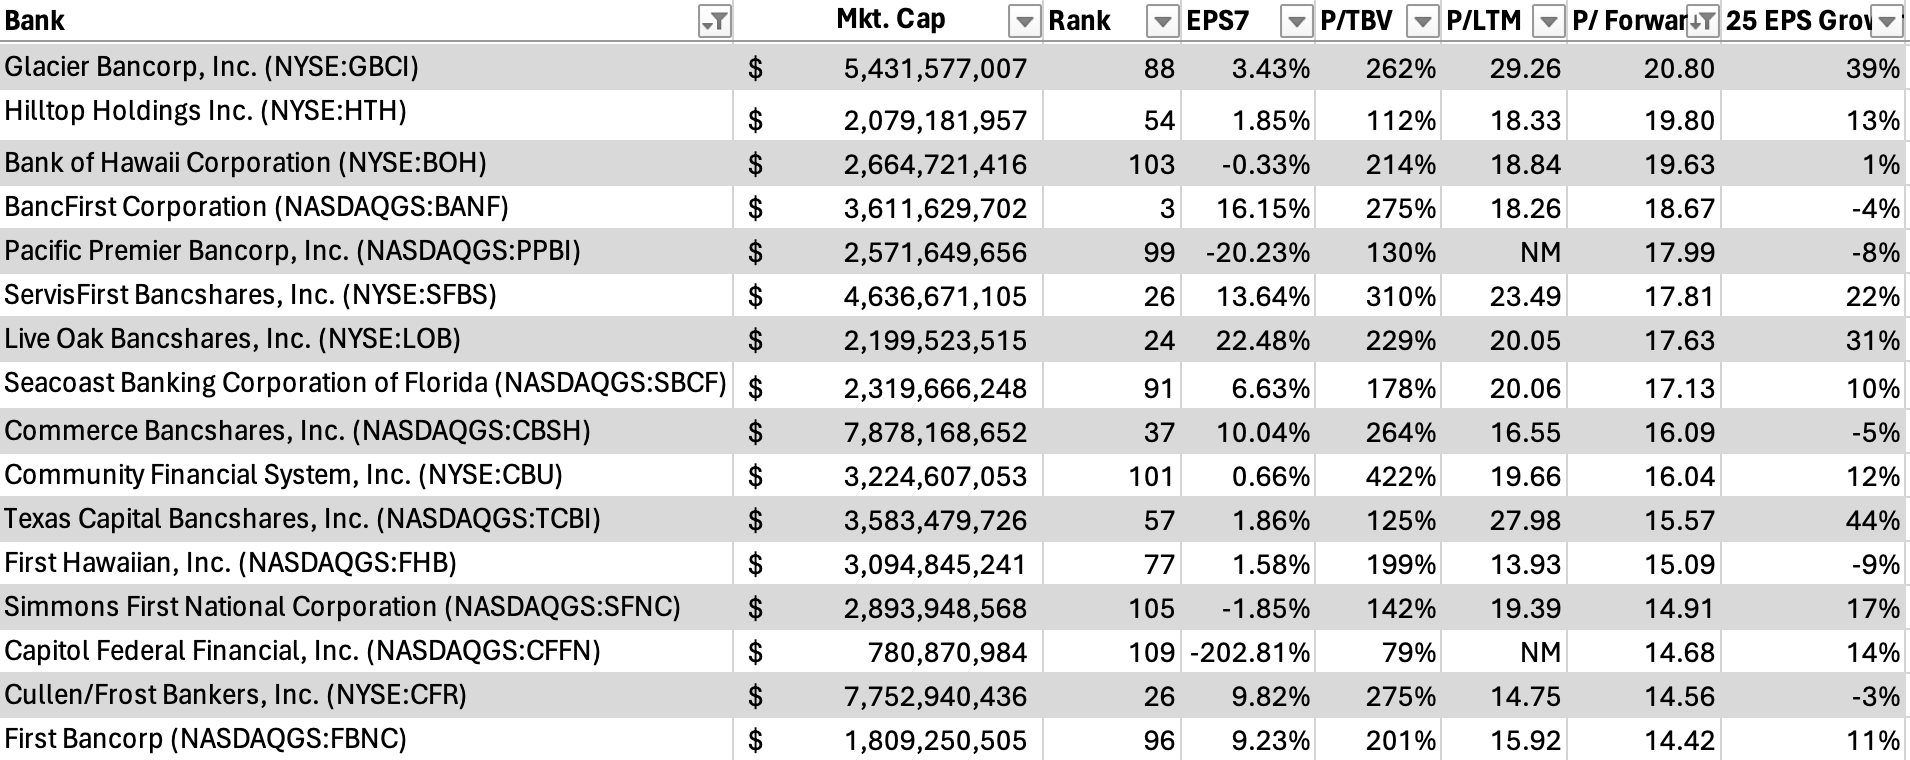
Examples Of Growth Premium:
LOB historically has been able to grow EPS above and beyond their peers (looking at a trailing 7-year CAGR), which gets them a premium multiple
BANF is another example of long-term track records of growing EPS, which people reward with a higher multiple
3. Precedent Transactions: The “What Have Others Paid?” Method
This method looks at what other banks have sold for in the past. It is also the least useful for me.
Every bank is unique. Just like Forrest Gump said, “life is like a box of chocolates, you never know what you’re going to get”—the same is true of banks. Finding a “true” precedent is tough.
When Looking At Precedent Transactions, Consider:
The premium paid over the target bank’s stock price
The P/TBV and P/E multiples of the deal
The strategic rationale behind the acquisition
The economic and regulatory environment at the time of the deal
A Cautionary Example
In 2022, TD Bank announced its acquisition of First Horizon for $13.4 billion, representing a 37% premium to First Horizon’s closing share price. The deal valued First Horizon at about 2.1x its tangible book value.
But here is the kicker: In May 2023, TD Bank called off the deal due to regulatory concerns. It would later be found out that TD was doing some awful and shady stuff with unsavory characters. This landed them in purgatory with the regulators as it should.
This ended up not being a good precedent.
Current M&A Multiples
More examples can be found at Rick Childs’ X account. Currently, all announced 2024 bank M&A deals have carried around a 125% to 135% P/TBV multiple.
Credit unions have paid way above these for the most part, which is distorting “true value” for banks, in my opinion. The fact that they are not taxed, do not pay dividends, and have different goodwill accounting means they can drastically overpay.
With comparable transactions, you will probably get to some level of the same place that you would with my ROTCE/P/TBV scatter framework plus or minus a little. So I tend not to use it.
Beware: Investment bankers and real estate agents love using this one to drive up prices in M&A.
The Nitty-Gritty: Bank Earnings Cash Flow Drivers
Understanding what drives net income is critical for bank valuation.
I care primarily about net income and EPS because I believe that over the long haul, earnings via EPS and bank value are correlated. That plus Revenue per Share and Tangible Book Value per Share all contribute to growing shareholder value.
The Main Levers For Bank Net Income/Earnings/EPS
1. Net Interest Income
This is the spread between what the bank earns on loans and pays on deposits. For most banks (non-money centers), it is typically 80%+ of the net income the bank generates.
Net Interest Income Is Affected By:
Asset yields: The interest rates the bank charges on loans
Deposit costs: The interest rates the bank pays on deposits
Loan growth or contraction: How much the bank’s loan book is expanding or shrinking
Paydowns of past assets and repricings: How much the bank’s assets are coming back to them to be reinvested
Mix shift: Is a bank taking money from loans and putting it into lower yielding bonds, or vice versa?
Net Interest Margin (NIM) Is A Key Metric: NIM = (Interest Income - Interest Expense) / Average Earning Assets
Banks that are overly dependent on NIM rarely carry a premium multiple to the rest of their cohorts. Unless, of course, they have a “moat” or “niche” lending vertical that no one else can touch.
2. Non-Interest Income
This includes fees from various services.
Major Non-Interest Income Sources:
Wealth management: Banks charge fees for managing investment portfolios and providing financial advice
Investment banking: Banks earn fees from underwriting securities, advising on M&A, and trading
Card processing: Banks make money from interchange fees, cardholder fees, and partnerships with card networks
Mortgage banking: Banks earn through origination fees, interest on loans, and servicing fees
Each of these verticals can have a significant impact on the bank’s overall value. For some banks, like Goldman Sachs, non-interest income can be a major part of their business.
Banks with heavy non-interest income verticals with moats are the holy grail from a valuation standpoint and should trade higher. They have found a way to “escape” the low multiples present for most banks.
3. Non-Interest Expense
The majority of non-interest expenses for banks typically include:
Personnel costs (salaries, bonuses, benefits)
Information technology costs (maintaining and upgrading IT systems)
Legal and consulting fees
Facility costs (rent, utilities, maintenance)
Marketing and advertising expenses
M&A works in large part because exec salaries are a big number. When a merger happens, you do not need two CEOs or two CFOs (unless you are EGBN).
4. Provisions For Credit
Provisions for credit are funds set aside to cover potential losses from loans and credit exposures. These provisions act as a financial buffer, ensuring the bank can absorb losses from delinquent or defaulted loans.
Essentially, it is a way for banks to prepare for and manage credit risk, maintaining financial stability and compliance with regulatory requirements.
5. Asset Quality
This refers to the risk level of a bank’s assets, particularly its loan portfolio.
Key Asset Quality Metrics:
Non-Performing Loan (NPL) ratio
Net Charge-Off (NCO) ratio
Loan Loss Reserve ratio
You want lower levels of these numbers. Credit is almost always what takes banks down and is why banks trade as levered beta (cyclicals). Rising and falling with the broader health of the economy.
Two Additional Factors That Matter For Valuations
Capital Adequacy
Banks need to maintain certain capital ratios to satisfy regulators. The Common Equity Tier 1 (CET1) ratio is a key measure:
CET1 Ratio = Common Equity Tier 1 Capital / Risk-Weighted Assets
A higher CET1 ratio means the bank has a stronger capital position, but it might also mean lower returns on equity. You want to shoot for being like JPM with a high CET1 and high returns.
The Regulatory Landscape
We cannot talk about bank valuation without mentioning regulation. Since the 2008 financial crisis, banks have been subject to increasingly stringent regulations.
These Include:
Basel III capital requirements
Annual stress tests for large banks
The Volcker Rule, which restricts proprietary trading
While these regulations have made banks safer, they have also impacted profitability. This regulatory burden is one reason why many banks trade at lower multiples than they did pre-2008.
What Drives The Ship
To summarize: Numbers 1 and 2 drive the ship. Number 3 matters. Numbers 4 and 5 matter eventually.
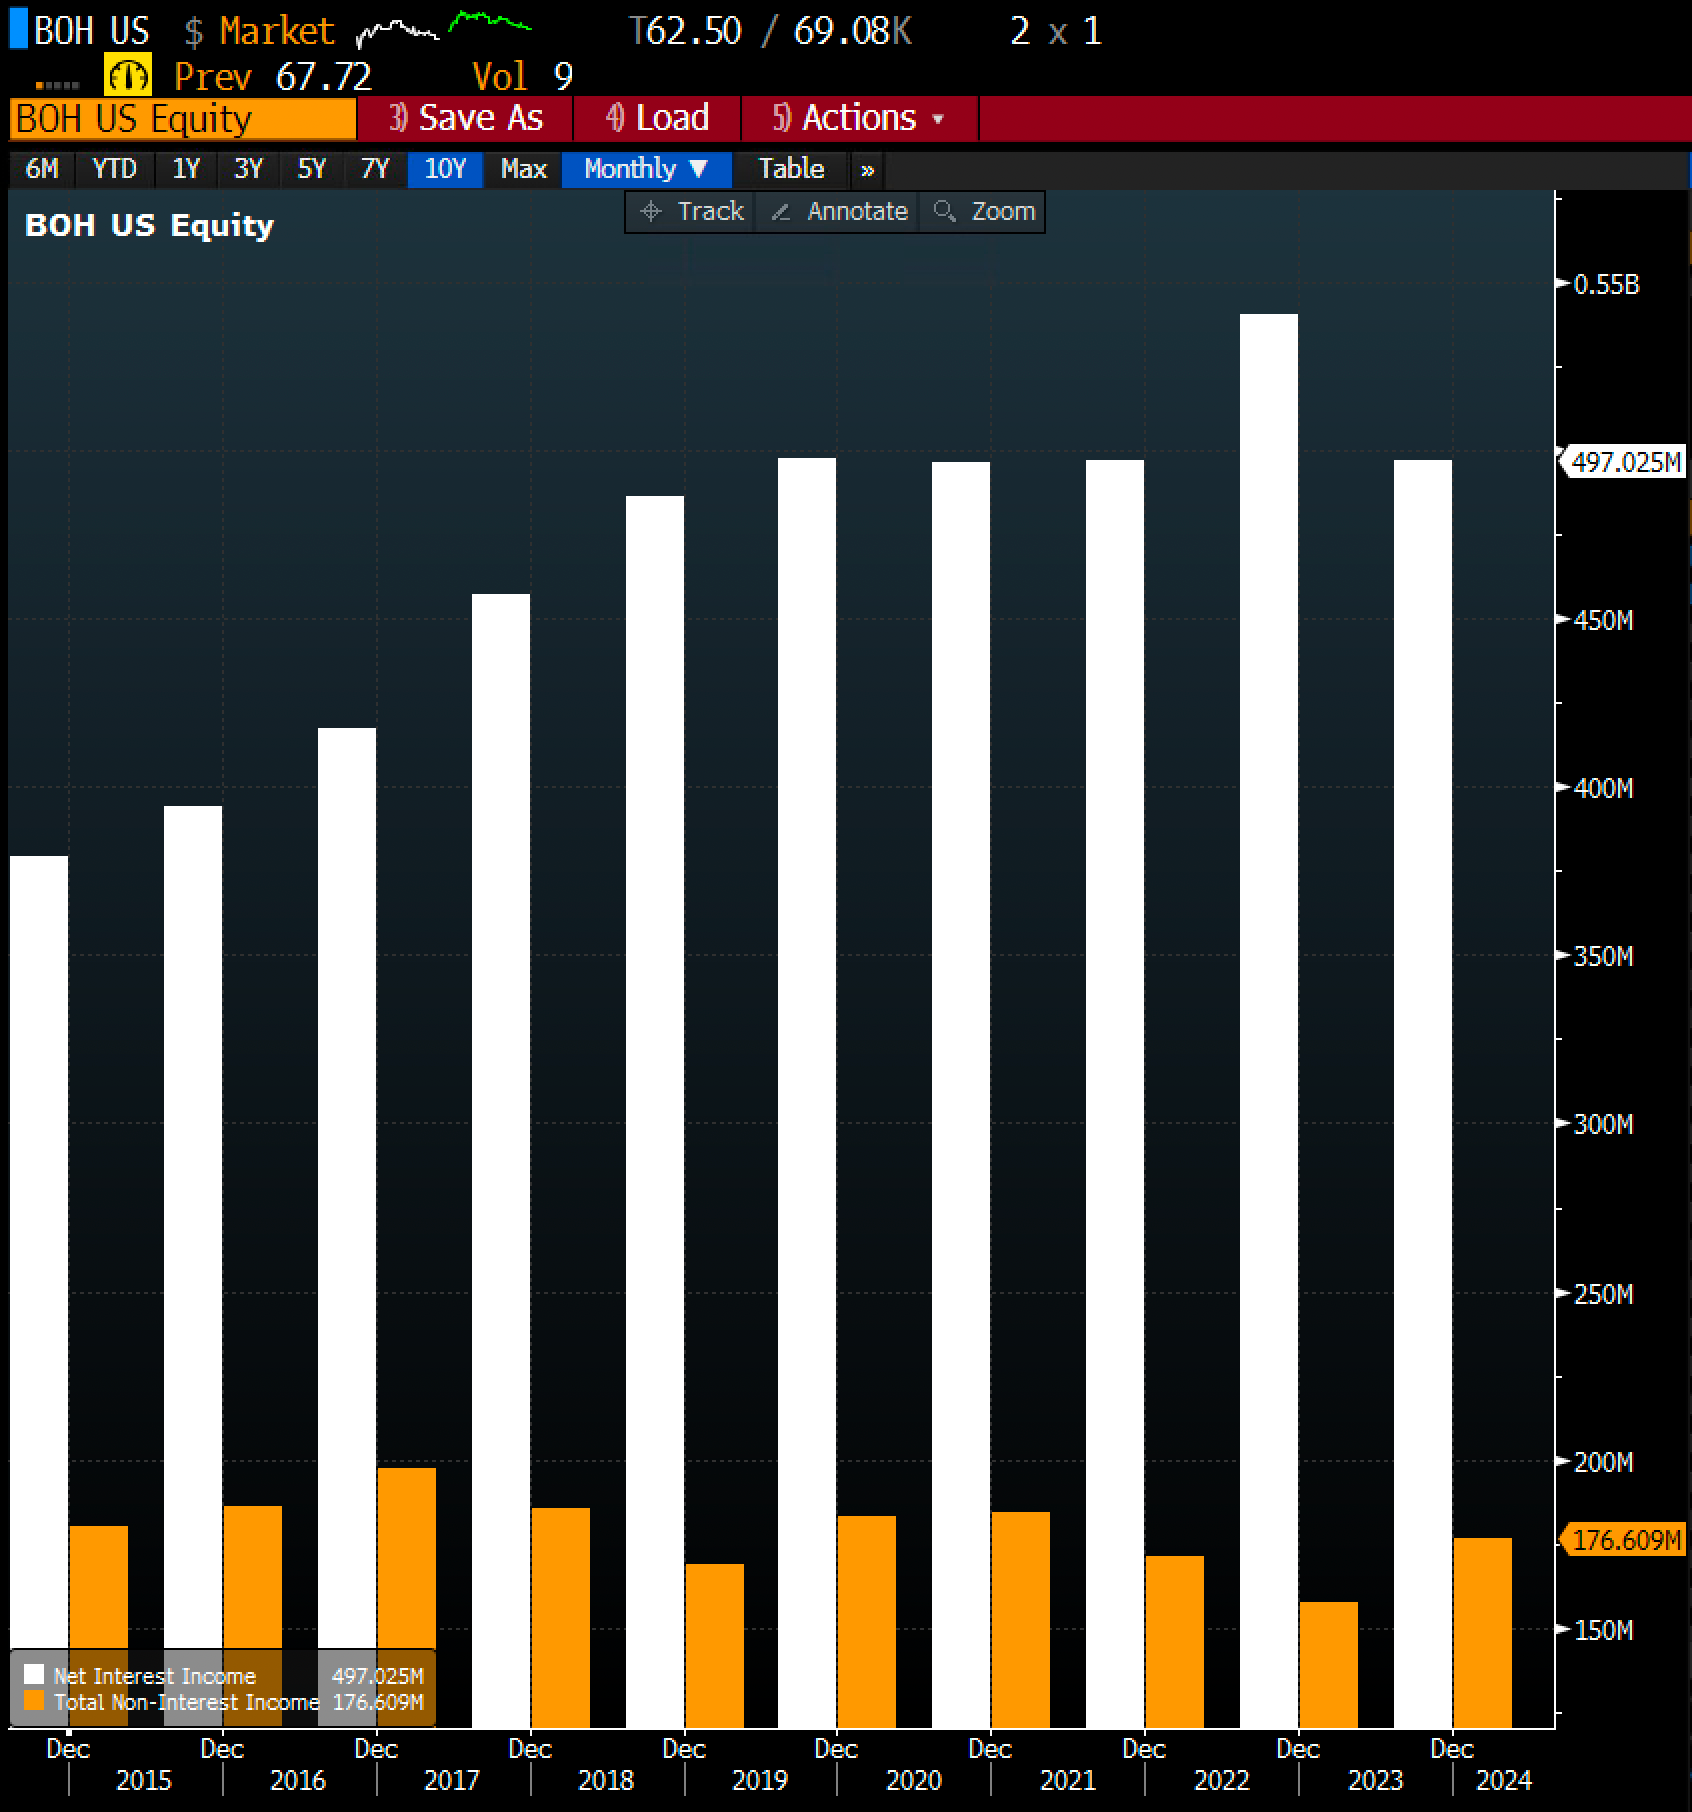
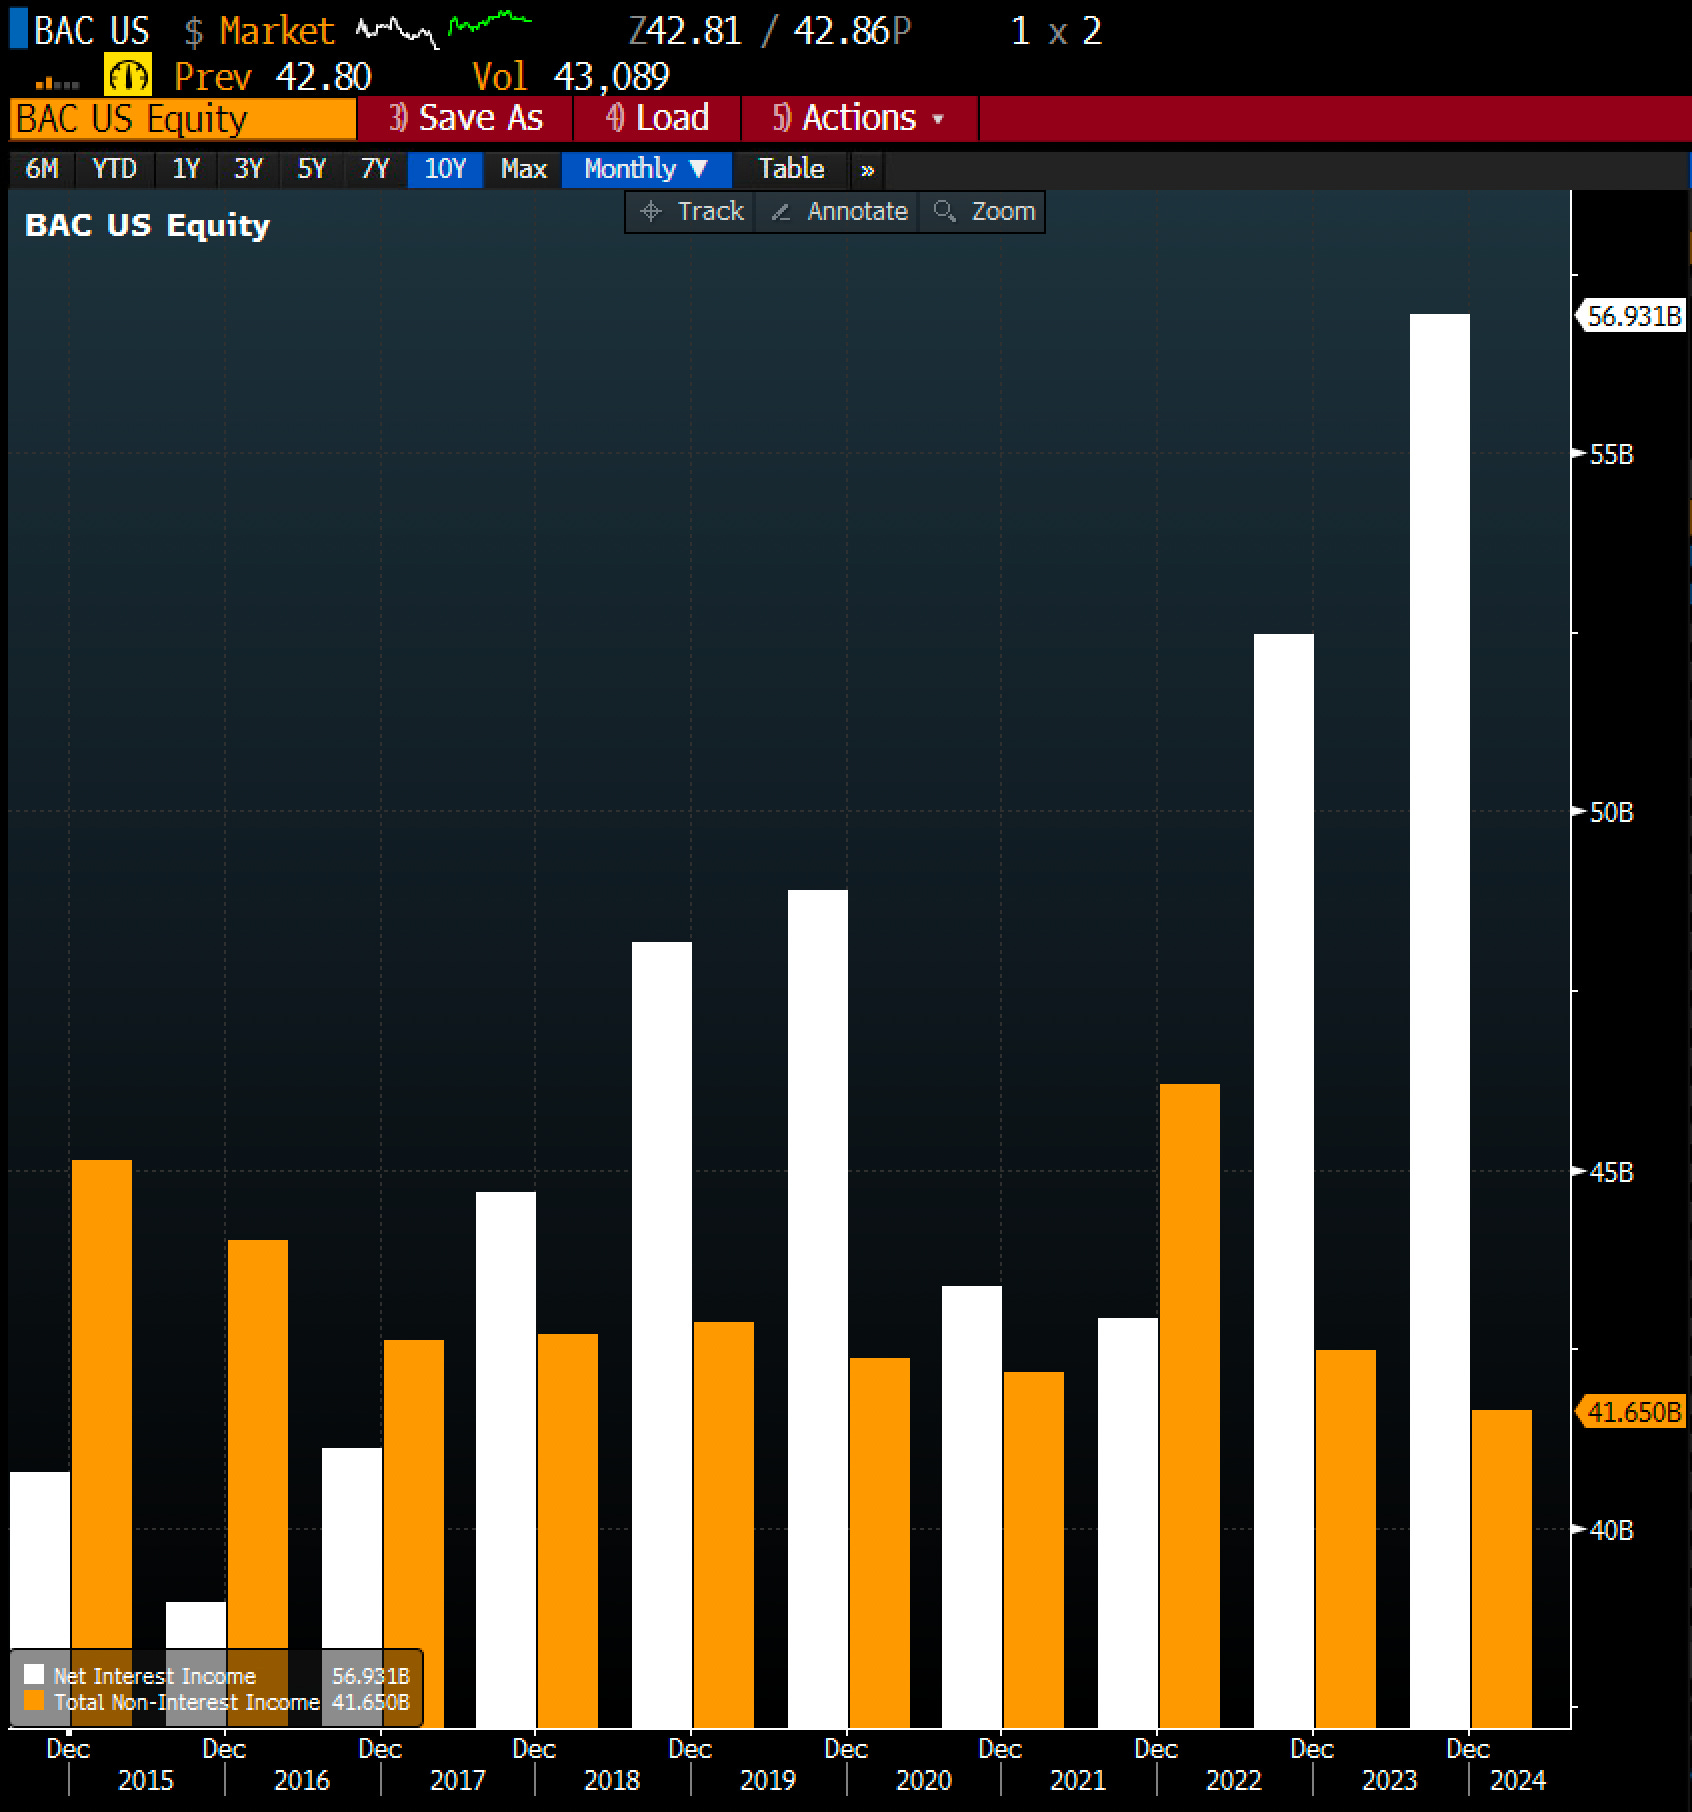
Different banks make money drastically differently, and so their valuations will differ as well. Compare:
Bank of Hawaii’s breakdown of net interest income and non-interest income
Bank of America’s breakdown
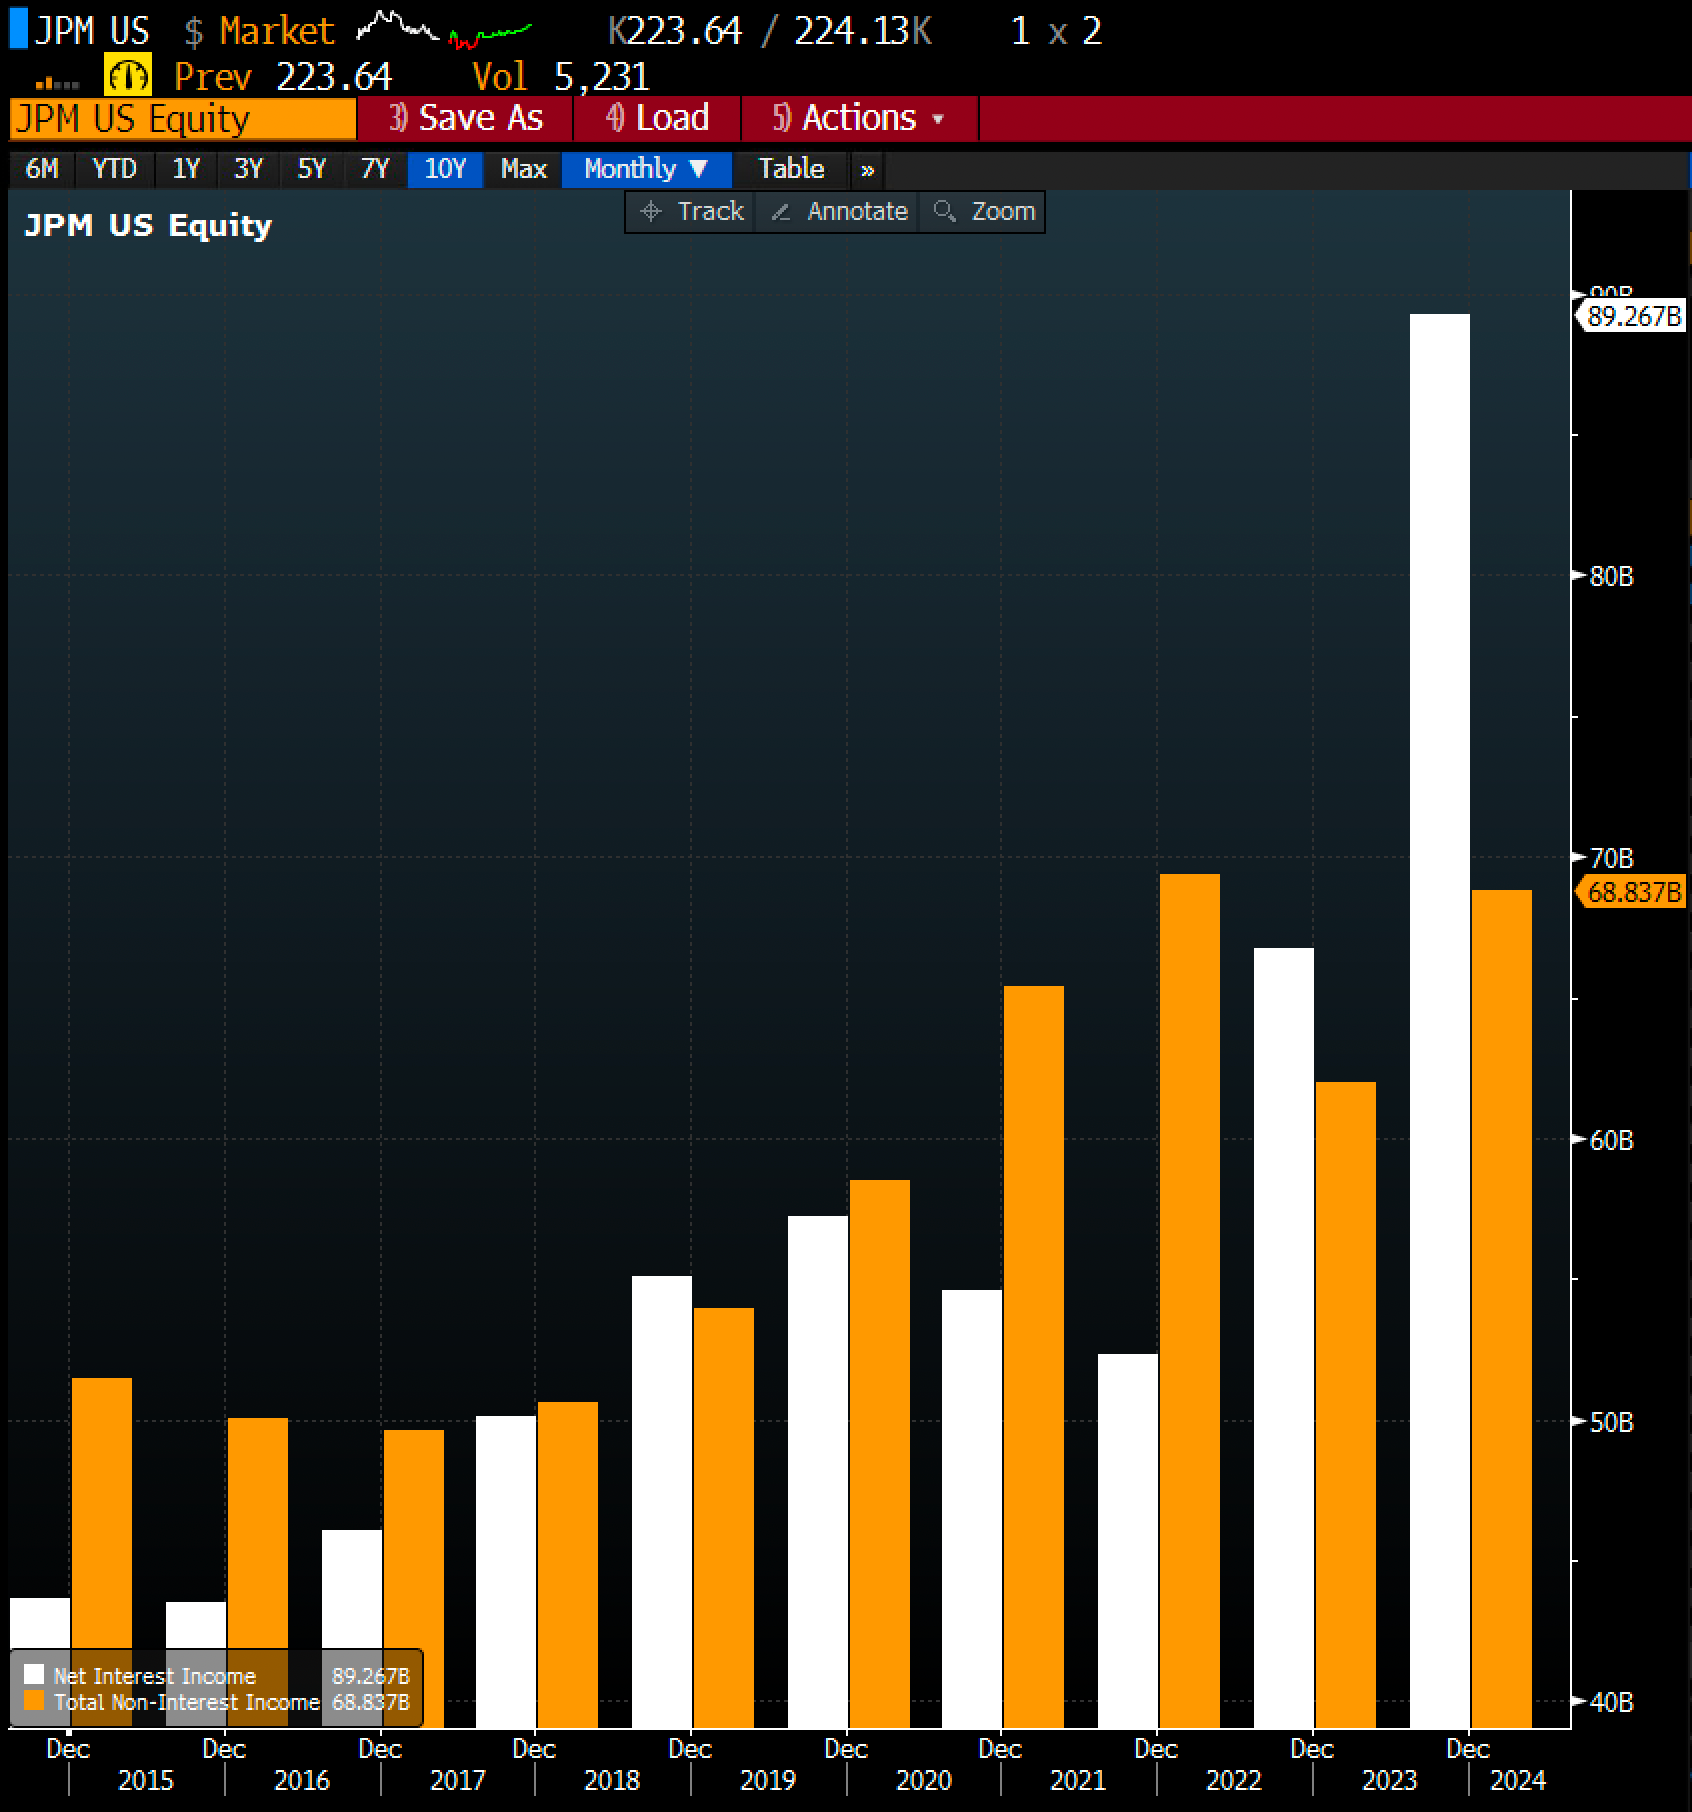
JP Morgan’s breakdown
Pathward Financial’s breakdown
Bank of Hawaii breakdown of net interest income and non:
Bank of America breakdown of net interest income and non.
JP Morgan breakdown of net interest income and non.
Pathward Financial net interest income and non.
Putting It All Together: How To Value A Bank
A bank’s value is essentially a function of:
Its current tangible book value (TBV)
Its current earnings power (net income/EPS)
Its ability to grow those earnings
The quality and stability of those earnings
People’s perceptions of future earnings (P/E multiple)
As Simple As Possible And No Simpler
Here is how I would price banks if I were a novice or myself:
The Three Core Questions:
What is the bank earning now? Net income.
What will it earn in the future? Stick to 12 months and no further. Everything beyond that is fugazi.
What is that future earnings stream worth in terms of multiple? Is it more durable than others? Less durable? Adjust multiple based on the answers to those questions.
The Simple Valuation Framework
This should spit out some number. A $1 billion bank with $100mm of TBV making $10mm a year should be worth TBV plus some premium (25% is current premium for a decent bank). So call it $125mm.
If you see earnings as risky, it should be worth less
If you see earnings growth, it should be worth more
The Macro Factors You Must Consider
From a macro standpoint, you also have to have somewhat of an opinion on:
The interest rate environment (tailwind or headwind)
The stage of the credit cycle (kryptonite for the sector)
Potential regulatory changes (wet blankets on returns)
Investors’ love or hate for the sector (flows for pros)
Answer if you see things getting much better, much worse, or staying the same.
The Importance Of Net Income And Future Earnings
A critical aspect of bank valuation is understanding a bank’s net income, both current and projected.
Current Earnings Power
A bank’s current net income provides a snapshot of its ability to generate profits in the present environment.
Future Earnings Potential
Projecting future net income is key to understanding a bank’s growth trajectory and long-term value.
Earnings Quality
Not all earnings are created equal. Understanding the sources and sustainability of a bank’s net income is crucial for accurate valuation.
Remember: Focus on the next 12 months of earnings. Anything beyond that becomes increasingly speculative.
Closing Thoughts: The Art And Science Of Bank Valuation
Let’s recap the key takeaways and synthesize the critical concepts.
The Foundation
Tangible Book Value (TBV) serves as the bedrock of bank valuation, providing a baseline for a bank’s worth.
The Methods
The three primary methods, Discounted Cash Flow (DCF), Comparable Company Analysis, and Precedent Transactions, each offer unique insights, but none are perfect on their own.
The Key Drivers
Understanding the core drivers of bank earnings is crucial:
Net Interest Income
Non-Interest Income
Non-Interest Expense
Provisions for Credit
Practical Valuation Tips
When valuing a bank, keep these practical tips in mind:
Start With The Basics
What is the bank earning now? What will it earn in the future (focusing on the next 12 months)?
Assess Earnings Quality
Is the earnings stream more or less durable than peers? Adjust your valuation multiple accordingly.
Consider The Macro Environment
Factor in the interest rate environment, the stage of the credit cycle, potential regulatory changes, and investor sentiment towards the banking sector.
Use A Simple Framework
A decent bank might be worth its Tangible Book Value plus a 25% premium. Adjust this based on your assessment of earnings risk and growth potential.
Be Patient
As Stan Druckenmiller said, “The big money is not in the buying and selling, but in the waiting.” Sometimes, the best decision is to wait for the right opportunity.
The Role Of Reflexivity In Bank Valuation
An often overlooked but crucial concept in bank valuation is reflexivity, popularized by George Soros. In the context of banks, reflexivity suggests a two-way feedback loop between a bank’s fundamentals and its market valuation.
How Reflexivity Works:
A bank trading at a high multiple might find it easier to raise capital or make accretive acquisitions, potentially improving its fundamentals and justifying an even higher multiple.
Conversely, a bank trading at a low multiple might struggle to grow or face higher funding costs, potentially leading to deteriorating fundamentals and an even lower multiple.
This reflexive relationship means that market perceptions can become self-fulfilling prophecies to some extent. It underscores why understanding both the intrinsic value of a bank (based on its net income, earnings quality, and growth potential) and market sentiment is crucial for investors.
Final Thoughts
A lot to think about, but hopefully this helped shed some light on how to price banks.
Remember, as Charlie Munger once said, “It’s not supposed to be easy. Anyone who finds it easy is stupid.” So embrace the challenge, continue learning, and happy investing!
The best is ahead,
Victaurs
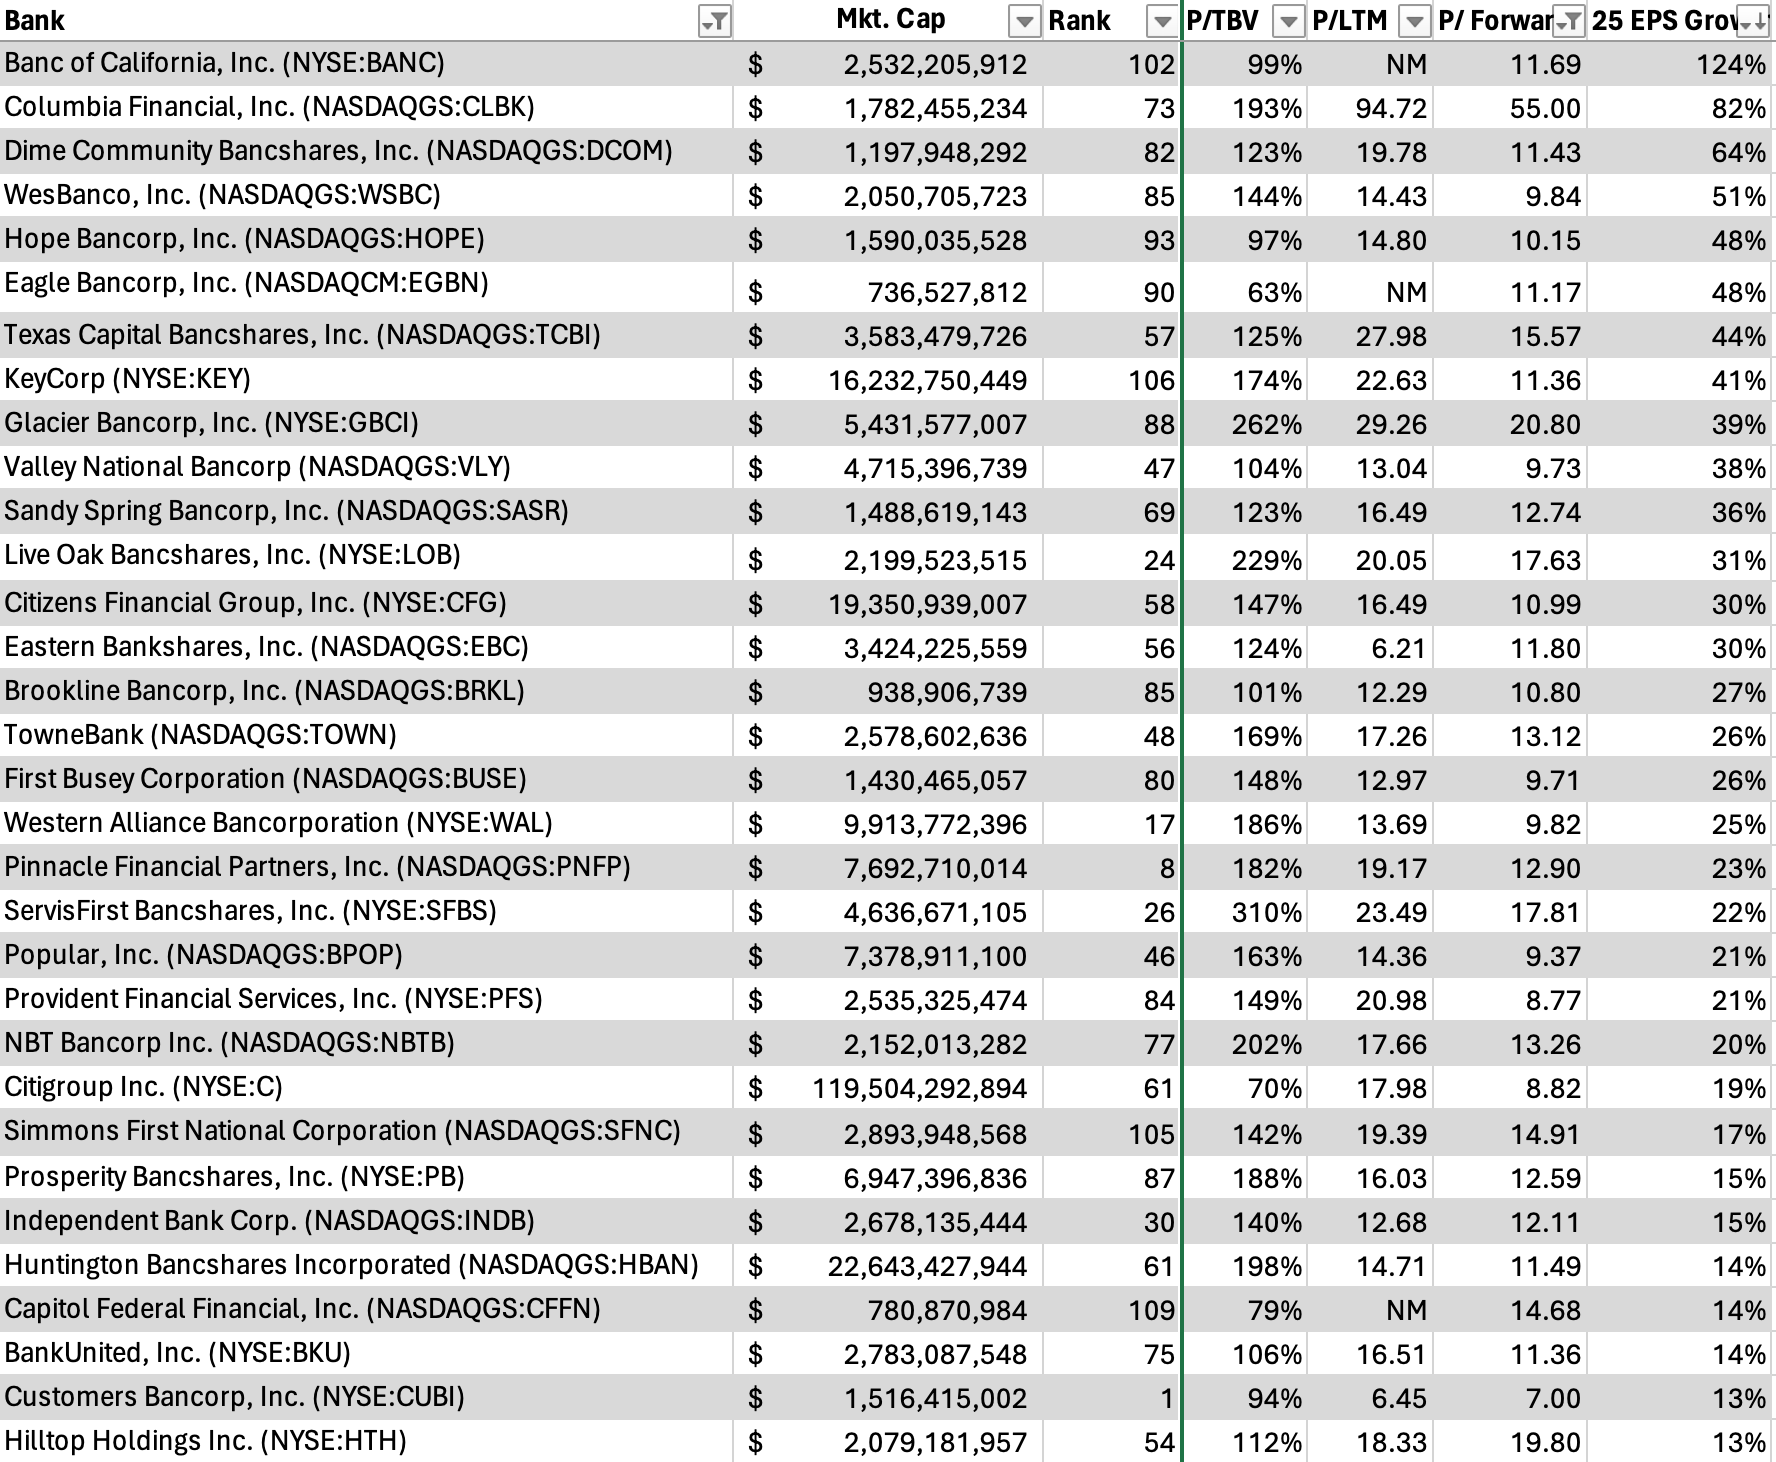
PS - if you made it this far, here’s the richest and cheapest regional & big banks to 2025 ROTCE as well as the banks with the current biggest ‘25 EPS estimates. Normally these are paywalled.
Cheapest:
Richest:
Biggest EPS Growth in ‘25: