The Golden Age Revisited: Looking Back on December's Big Bank Call
A retrospective on the "Golden Age" thesis: analyzing earnings growth, the return of the yield curve slope, and why big banks separated from regionals.
In this game, taking a victory lap is the quickest way to lose your footing. The market loves to humble you the moment you start believing you have it all figured out, so I am not writing this to point at the scoreboard. This is about process and about looking back to learn.
Go back to December of 2024 when I posted the original “Golden Age” bank thesis calling for big bank outperformance. The consensus was paralyzed by the ghosts of banking crisis past. Everyone was staring at Silicon Valley Bank in the rearview mirror, convinced the entire “bank” sector was a value trap waiting to plunge. I took the other side, my argument was simple. You do not invest based on where the puck is sitting today, but the goal is to skate where it will be eighteen months down the road.
I identified three specific tailwinds that the crowd was ignoring because they were too busy fighting the last war like they always do. I called for earnings stabilization, a steepening yield curve, and a regulatory thaw. All three happened.
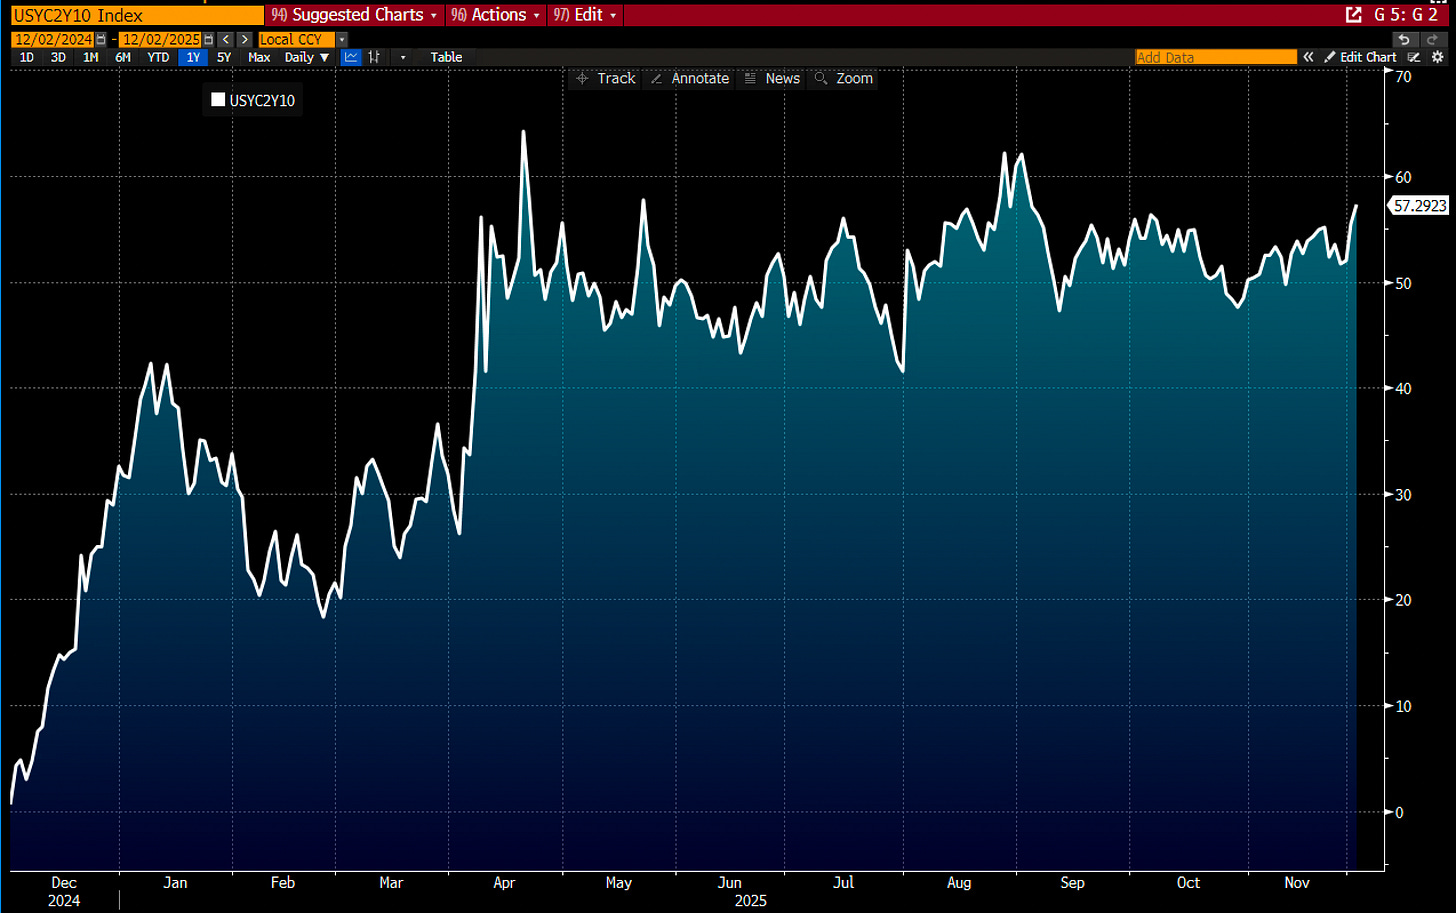
On the yield curve front, the 2s to 10s spread has crossed back into positive territory, sitting at 57 basis points this morning.
And the more applicable spread for bank margin prediction, the 3 month to 5 year spread, which spent years inverted is on the cusp of completely un-inverting. As the Fed fought inflation, 150bps of inversion crushed the life blood of bank income, NIM. And as cuts to the short end come to fruition, the NIM engine can breathe again at least in theory.
And as predicted, the regulatory environment has thawed as well. SLR relief, quicker M&A timelines, and a more “bank friendly” as opposed to regulator friendly tone has been taken.
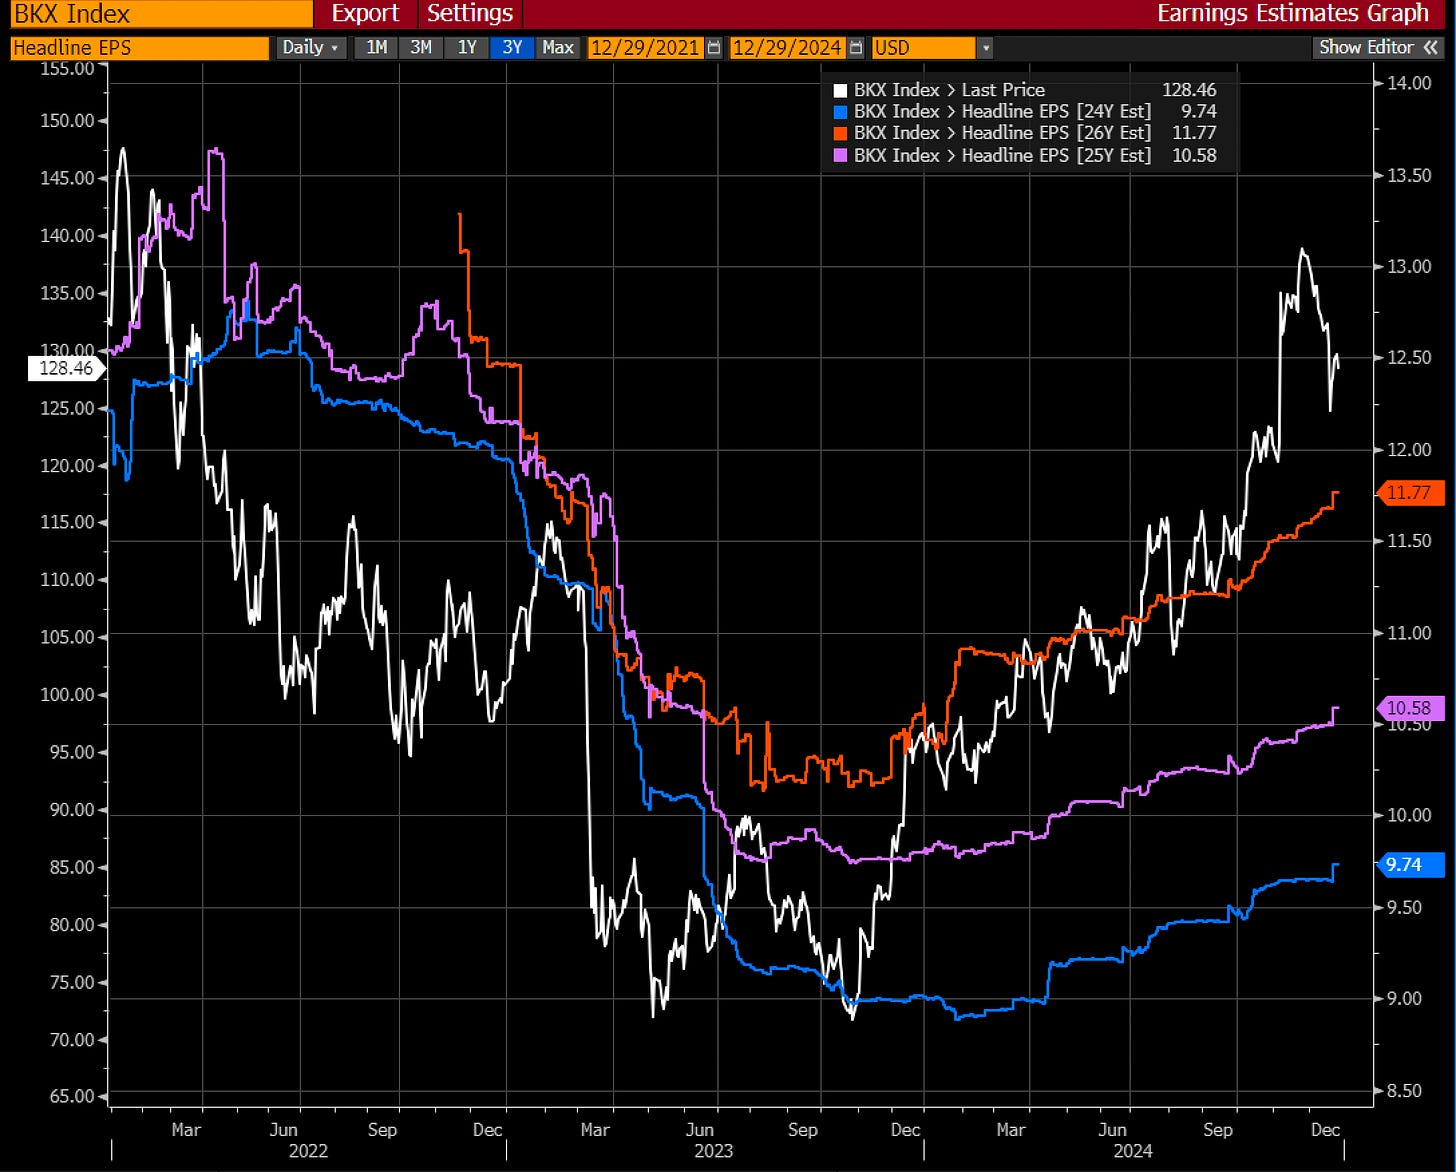
And all of this has contributed to earnings increasing as projected. BKX the big bank index saw earnings increase about 18% so far this year from 2.65 to 3.15 a share.
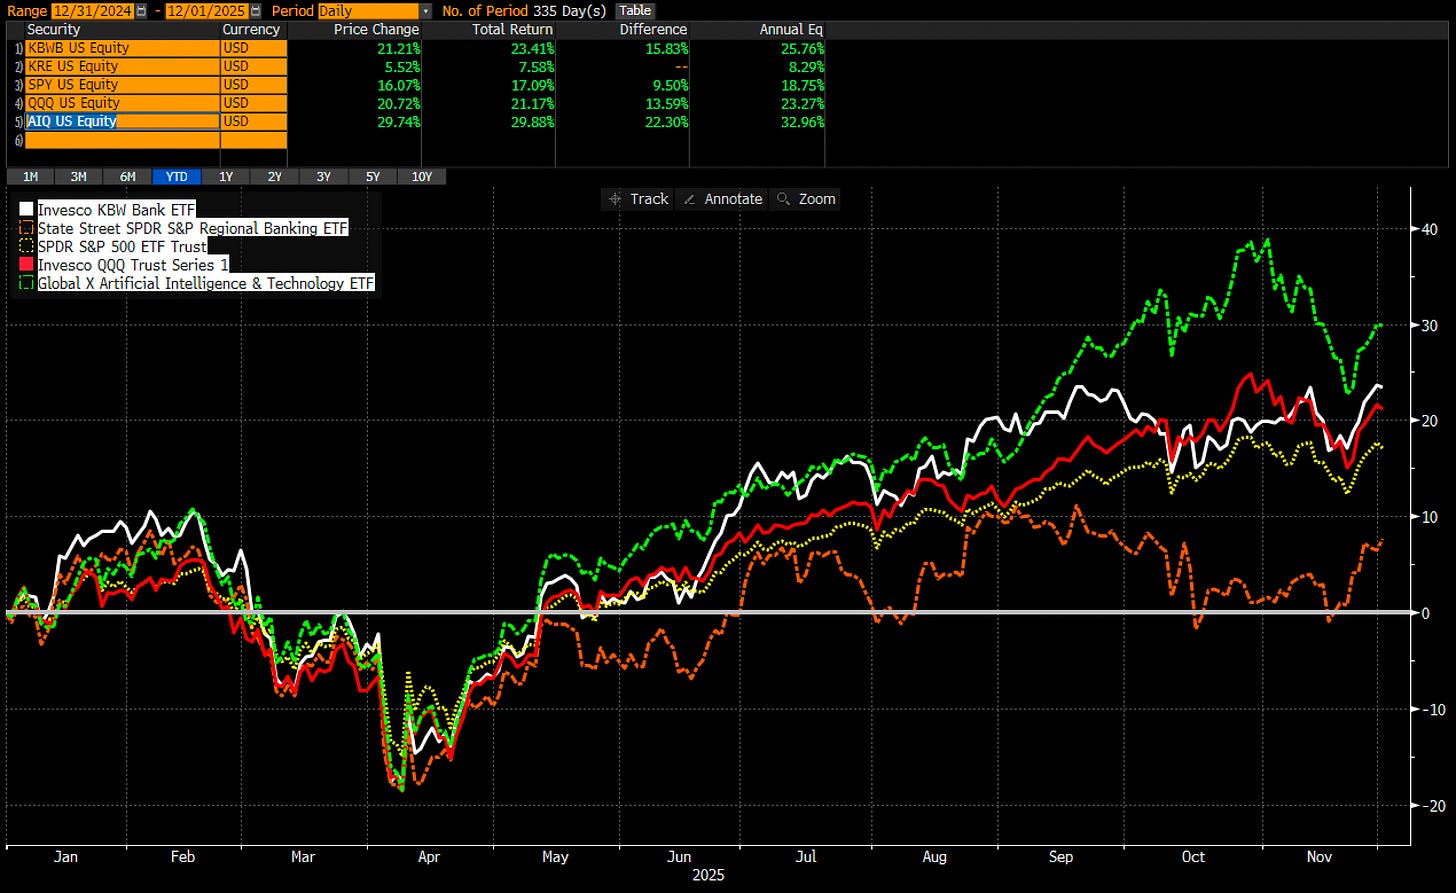
If you’re not a bank native, the question becomes why did the big money center banks tear higher while the regional index felt like walking through mud. Big banks had returns on par with SPY & QQQ and lost only to sectors like the more AI focused AIQ whereas KRE stayed completely stuck.
The first reason for the divergence is the business model. A giant like JPMorgan is a financial supermarket not reliant on spread income. When rates are upside down, they lean on trading revenue and investment banking fees to keep the earnings machine running. A regional bank is a simpler machine, it relies on NIM & spread more.
The second reason lies in the plumbing. You have to distinguish the instrument from the asset. The regional bank ETF, the KRE, is equal-weighted. It treats a high-quality compounder the exact same way it treats a bank with a hole in its balance sheet. In fact, quarterly it re-allocates money to the losers as their market cap as a percentage of the ETF shrinks. It violates Paul Tudor Jones #1 rule for investing: losers aveage losers.
Where do we go from here?
That’s highly dependent on the name, the price, and the fundamental set up. Some names look great, some look terrible. Some are highly priced without much margin of safety, some still have upside left.
The best is ahead,
Victaurs
PS - bank historians will appreciate the time capsule section below on banking in the 90’s.
Stanley Druckenmiller once said, "Invest in where the situation will be 18 months from now, not where it is today." That principle is more relevant than ever in banking.
Today, opinions are sharply divided. The bears claim banks have hit full valuations, pointing to historical averages. The bulls counter with optimism, arguing there’s still plenty of room for growth.
Who’s right? And more importantly, how should you position yourself?
Read on to find out. And a Happy New Years eve to all.
Spoiler alert: I’m firmly in the bullish camp over the next 18 months but as you know I’m perfectly willing to be wrong and change my mind along the way.
Tailwind 1: Earnings Growth
One of the golden rules of investing is this: buy companies or sectors with rising earnings. Why? Because earnings growth drives stock value, the more a company earns the more a company is worth. And keep in mind also, earnings growth also impacts investor perception of future value.
Think of it like Newton’s First Law of motion: an object in motion tends to stay in motion unless acted on by an external force.
Plus realize that “the Madness of Crowds” is at work: humans while somewhat rational on an individual basis are gripped with FOMO and dreams of riches when crowds watch prices rise.
Starting in March of 2023, the banking sector was in full on crisis mode. Headlines were dominated by the high-profile collapses of Silicon Valley Bank (SIVB) and the “Buddhist transformation” of First Republic (FRC) into JPMorgan Chase. Signature got tapped for many unforgivable sins including (and not limited to) not having their discount window lines set up to meet deposit redemption requests during the panic. Across the country depositors fled, pulling money from banks in favor of safer alternatives. USTs? Sure. Money Markets? Yes please. Cash under a mattress? Maybe. And the world of Hedge Funds & Passives abandoned the bank stock ship in droves during this time. People were rushing to call this bank “a zero” and that bank “a donut” with panache and an almost reckless abandon. It was a crazy time, but the theme of 2023 was the “this is fine” meme day after day after day.
While the initial bank run and panic was bad, the fundamental earnings fallout was even worse for the banking industry. Deposits moved into higher-cost wholesale funding, including the Bank Term Funding Program (BTFP) a temporary program set up by the Fed to provide liquidity to markets. Net interest margins (NIMs) were squeezed, earnings estimates got slashed, and a dark cloud hung over the bank stock space. By the end of 2024, actual earnings per share (EPS) for the sector had dropped 20–30% below projections to start the year, falling from an expected $12 to just under $10. Forecasts for 2025 and 2026 were slashed as well. A grace check please for using Bloomberg consensus estimates on the indexes for my numbers, some astute (and way too knowledgeable of you) will poke that these are likely off by a penny or two.
And for a period of time things did what they always do, they stabilized. They slowly and methodically marched higher. The banking indices rallied, and sold off, and rallied, and sold off, and well you get the point. But a funny thing happened, no one really noticed until recently when Trump’s election became a certainty, and then banks took off with even the likes of Druckenmiller 13-F watchers noticing his love of banks.
But in 2024, the end of the world didn’t happen. And things started to stabilize. In fact, after bottoming in late 2023, earnings estimates began climbing steadily throughout 2024.
Investors in big banks are now eyeing solid growth:
2024 EPS (rough actuals): $9.74
2025 EPS (estimates): $10.58 (+20%)
2026 EPS (estimates): ~$12 (+10%)
Regional banks show a similar trajectory:
2024 EPS (expected): $7.89
2025 EPS (expected): $9.53 (+20%)
2026 EPS (expected): $11.46 (+20%)
As investors, while it’s fun to “catch the turn” in earnings projections and prices, it’s equally as profitable to ride inning 3 through inning 8. And while there are a whole host of things that can go wrong in the banking space, the trend at least for now is for higher earnings. To the valuation people, yes multiples are “fully valued” historically speaking but as with all things, history doesn’t have to repeat itself. People like to say banks trade off TBV, but that tends to be during low or no earnings growth periods like we just went through. During times of increasing earnings (or even earnings growth) banks can and will shift to an Earnings multiple world. Try as you wish, but for me I never like to fade increasing earnings growth.
Tailwind 2: Yield Curve Slope
Banking 101 tells us banks depend on the yield curve’s slope for earnings. They borrow short—through deposits or wholesale funding—and lend long (long being 5-7 years in duration), pocketing the spread. A steeper curve widens that spread, boosting profitability. In a world where the majority (non-Money Centers) derive 70% or 80% of their Net Income from Net Interest Income this potentially steeper yield curve is a massive tail wind to bank earnings. Larger money center banks like JPMorgan Chase are less reliant on spread income, but for the vast majority of the industry it’s all about spread income.
Taking the longest view, you can see that all bank industry NIM has been getting compressed since as long as we can remember, with intermittent periods of NIM expansion. The most recent of which in 2015-2019 (corresponding with a Trump Presidency) produced a healthy bank bull market.
The most recent inversion didn’t hurt bank margins too much nominally, taking them from 3.37% for all FDIC insured institutions in December of 2022, down to 3.17% in June of 2024. While this doesn’t seem like a lot, banks being levered and with limited ways to quickly bring down fixed costs felt the pain. From an industry standpoint this was not the most painful of episodes, but certainly individual banks felt the pain including nearly all of your recent equity raise banks that had to bailout their balance sheets and any bank with NIMs inside of 2%. Bank management teams at those institutions proved that just because you occupy the office of the bank C-suite and are paid hundreds of thousands of dollars, an expert in balance sheet management it does not make you.
Below is the chart showing the Fed Funds and 5 Year UST spread going back to the mid 1990’s. I show this only to show bank investors how historically inverted we have been on the bank part of the curve. Not only were we very inverted, but it was also very inverted for a long time.
While my crystal ball on interest rates is a bit cloudy, I do not see an environment where we return to this level of inversion any time soon. When you consider the amount of fiscal and monetary stimulus that produced the post COVID inflation wave, it becomes hard to fathom. Not saying it can’t or won’t happen, just that it’s unlikely. And if that’s the case we all have to remember that periods of inversion can be followed by long periods of slope. The 2000 to 2003 environment saw this spread breach 300 basis points which unleashed a massive bull market on the banking system with steady earnings growth and increasing stock prices. Similarly the 2015 to 2018 environment saw the spread hover above 100 basis points for years which coupled with a Trump election saw multiples expand and bank investors win.
Slope is a beautiful thing for bank investors and again I think we have a world so triggered by the searing memory of recent inflation that they can’t see the long view. One where periods of inverted yield curves can be met with equally long sloped yield curve periods. This type of environment would be very bullish for banks and is another tailwind worth riding.
Tailwind 3: Less Regulation
Banks tend to trade with multiples more like utilities than tech companies for a lot of reasons, but chief among them is the fact that they are heavily regulated. And to be fair they’ve earned some, if not most of the regulatory burden, over the years. But with Trump in office, I can promise you there will be a push (given historical precedent) for less regulation at least for the foreseeable future. Less regulation means among other things more bank M&A, the possibility of lower capital requirements, increasing amounts of buybacks, and all things equal higher and higher returns on equity. I’m getting more bullish just writing all this. But before we get to the good stuff, let’s quickly look back on why regulations have come in hard (in addition to not exclusive of the Democrats penchant for regulations).
A History Lesson in Leverage and Regulation
Before the GFC, banks operated with extreme leverage—sometimes as high as 20:1 and in some cases 40:1. Greedy managers took advantage of this to juice their own personal wealth at the expense ultimately of taxpayers who had to bailout their bad actions. Remember, in good times, leverage amplifies profits. In bad times, it magnifies losses, exposing not just their bank but the entire financial system to catastrophic risk. During the run up to 2008, banks gambled on products like NINJA loans, Alt-A RMBS, and CDOs squared with the discipline of a Fartcoin investor. At least it gave us movies like the Big Short though.
When the Jenga tower, we called the financial system crashed it made one thing clear: the reckless leverage had to be corrected. Regulators stepped in with the Dodd-Frank Act of 2010, a sweeping overhaul aimed at curbing risky behavior and systemic risk. The Obama admin changes were monumental at the time:
Higher Capital Requirements: Banks were forced to hold significantly more equity capital as a buffer against losses. Logical yes.
Stress Testing: Annual stress tests ensured banks could survive adverse economic scenarios. Fair yes.
Volcker Rule: Banned proprietary trading and limited ownership of hedge funds or private equity firms.
Creation of the CFPB: Introduced consumer protections to shield the public from predatory financial practices. Sowing the seeds for Warren’s overreach.
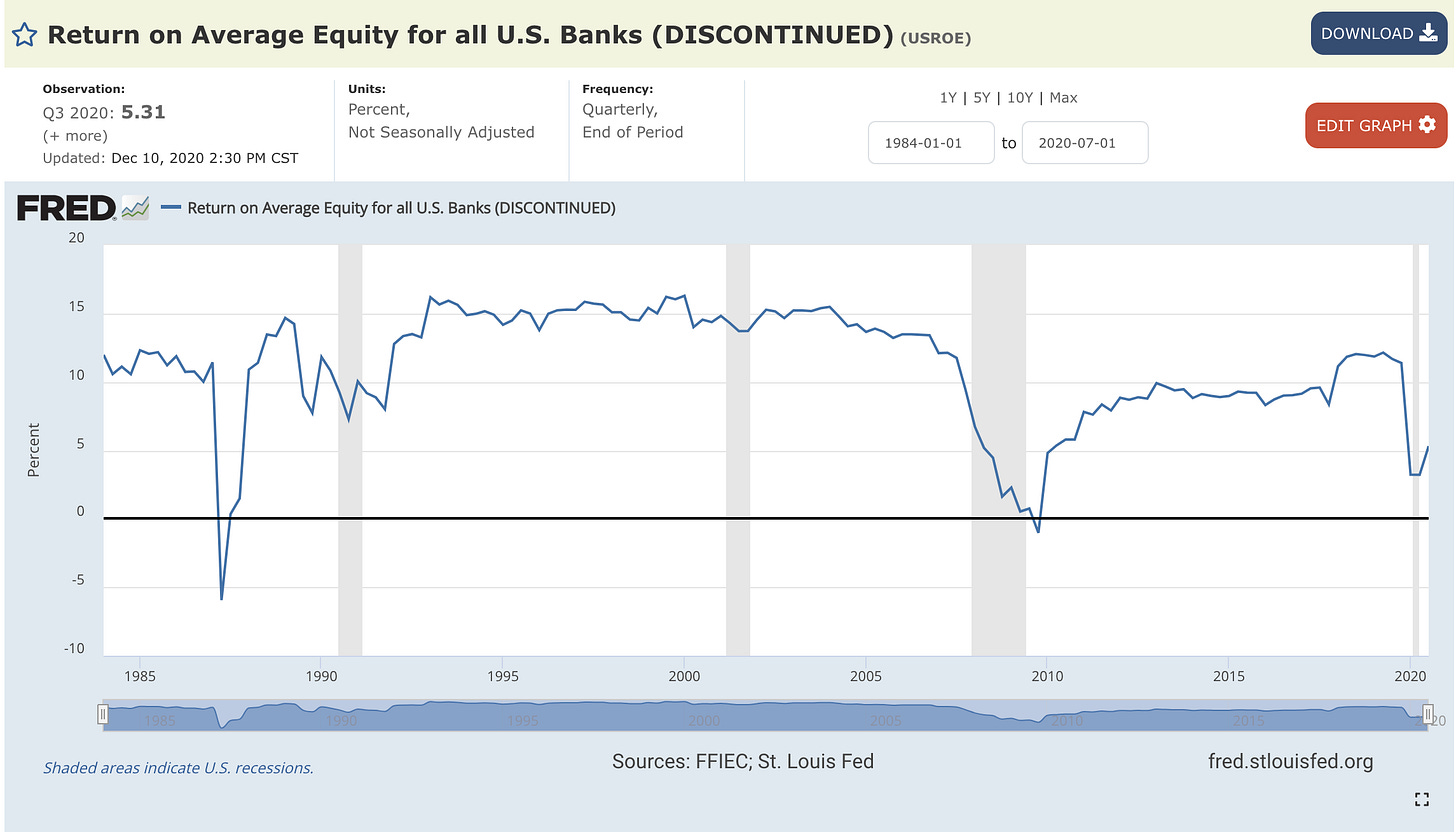
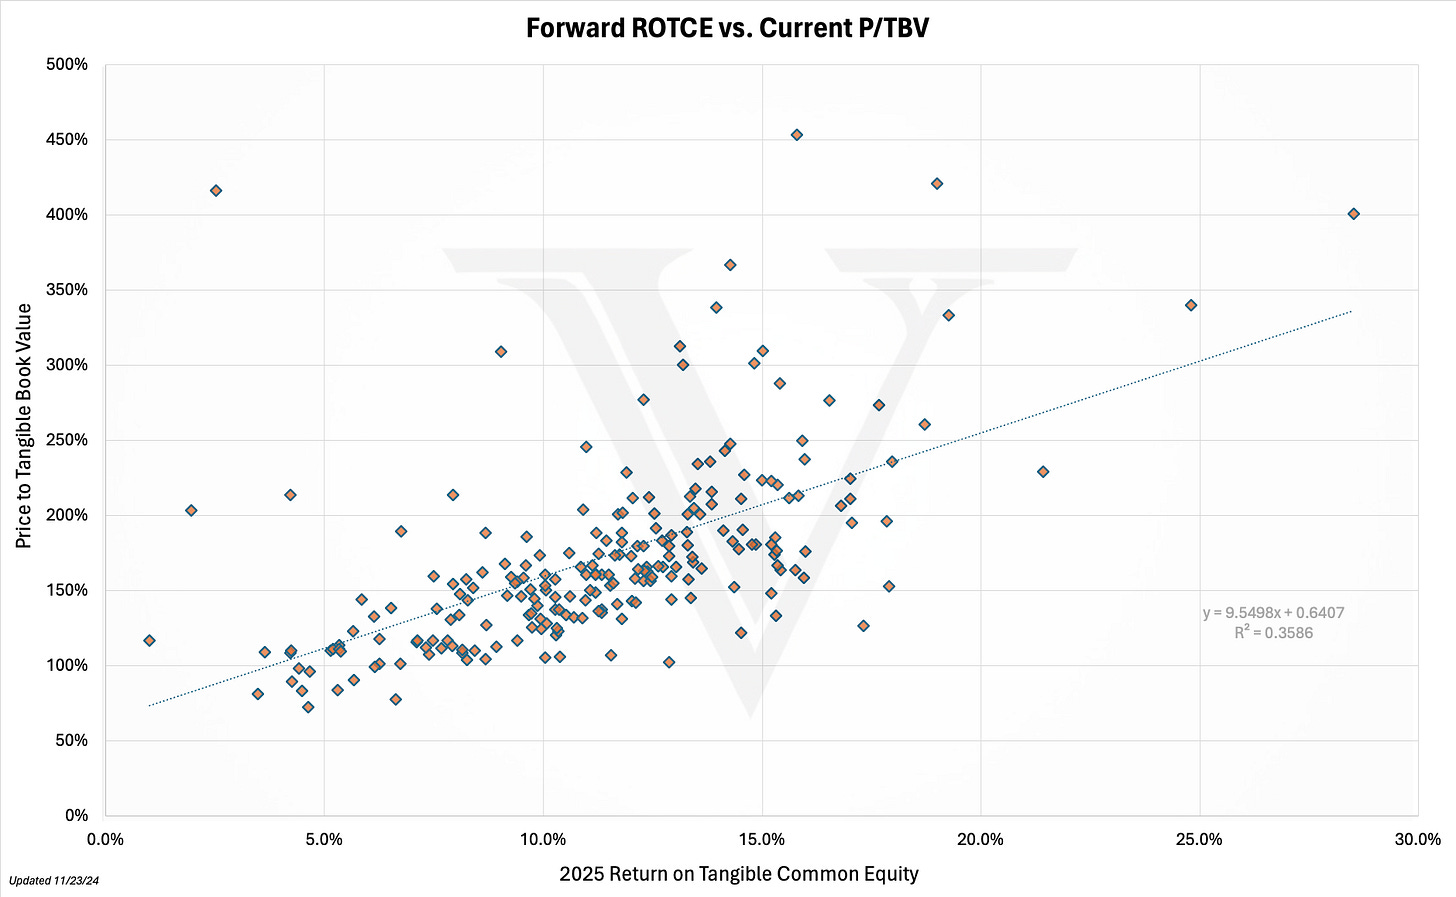
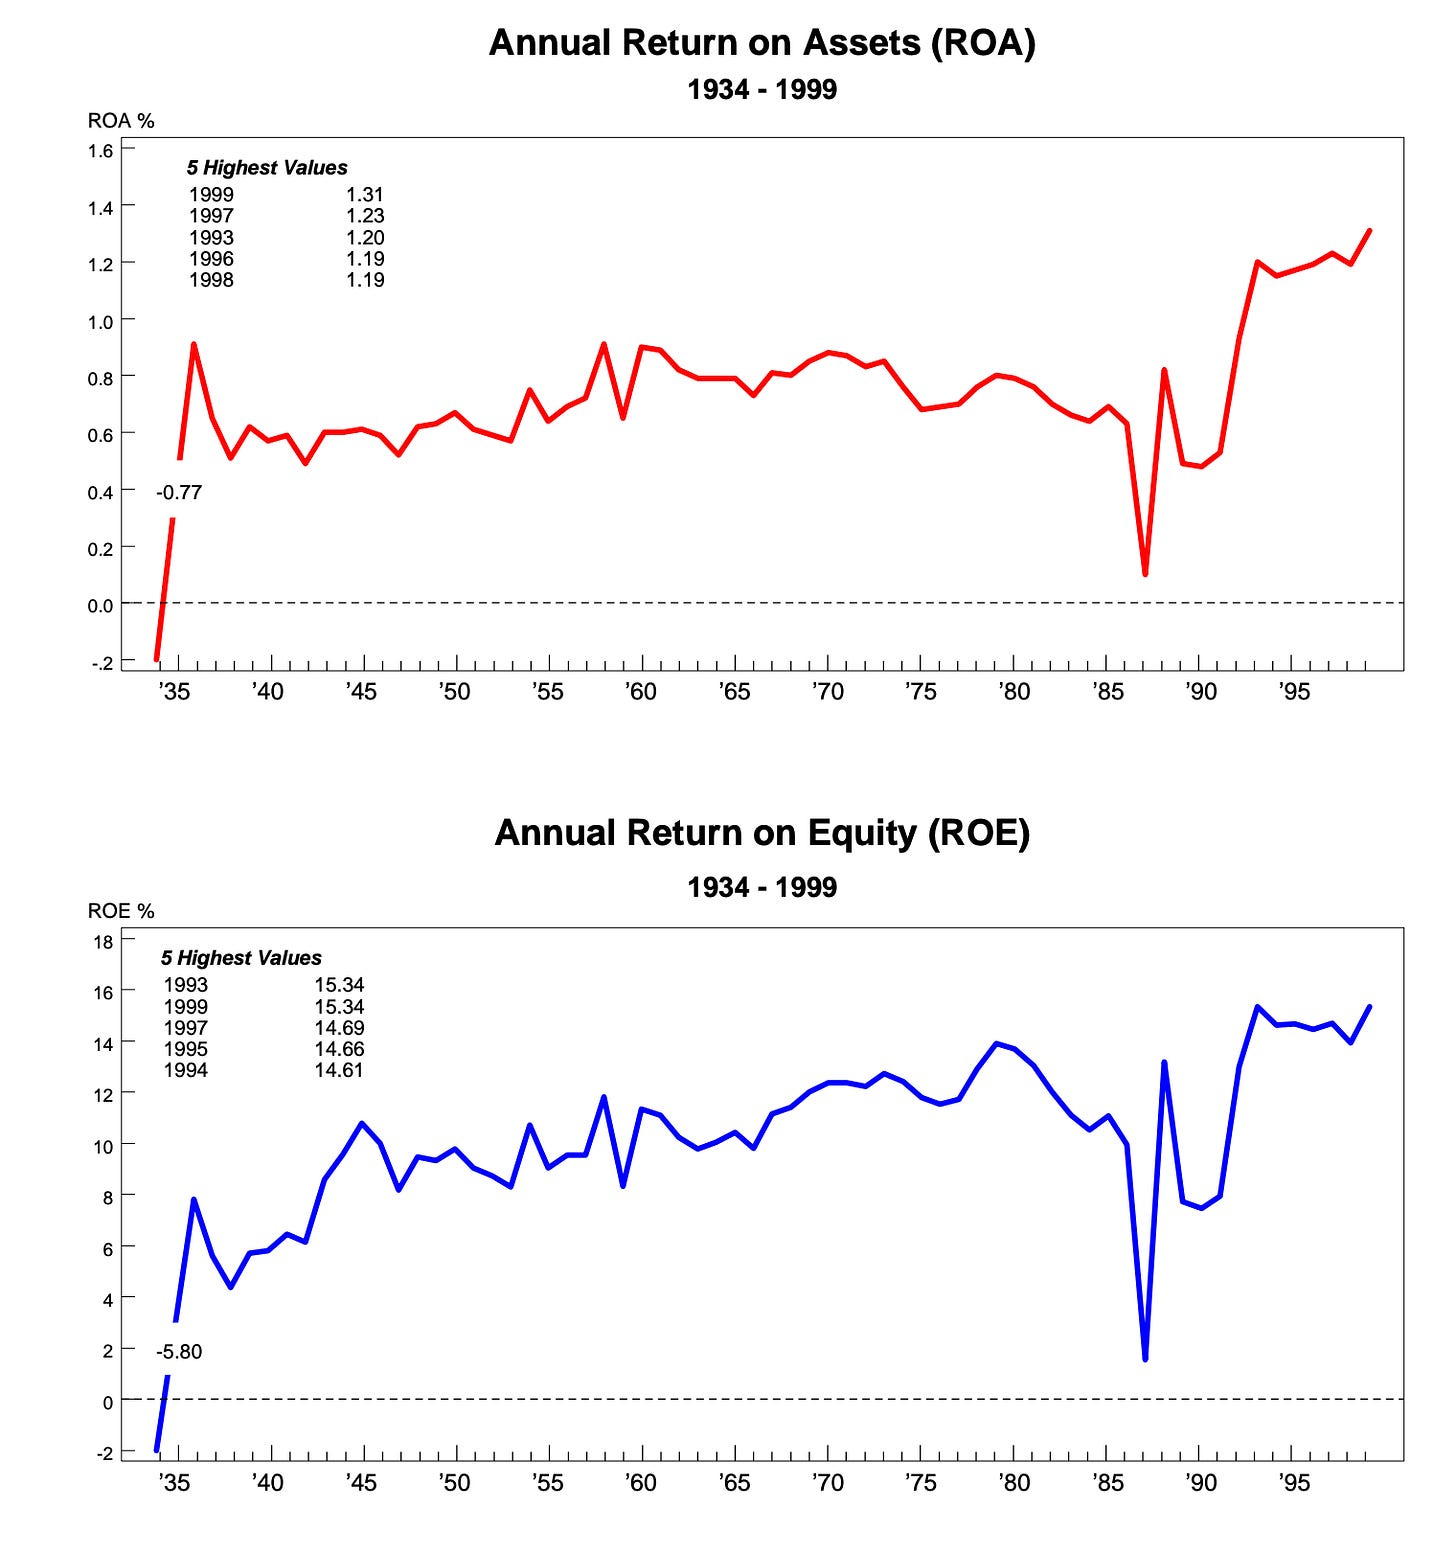
These measures made the system safer—but at a cost. Higher capital requirements and compliance burdens slashed ROEs, particularly for smaller banks. The industry became more stable, yes, but also less profitable. The chart below shows a discontinued Return on Average Equity for all U.S. Banks and it pretty clearly shows that Dodd-Frank put a wet blanket on bank returns that historically lived in the 15% range going back to the 1990’s, bringing them down to the 10% range. Rates contributed to the ROE drag, but so did the capital burden & regulatory climate.
The graph above actually kinks upward in 2017 due to the Trump 45 Presidency. This bump was largely tax cut related (more net income into the same equity). But during the 45 Presidency Trump promised to roll back the more burdensome parts of Dodd-Frank, and he delivered:
2018 Regulatory Relief Bill: Raised the threshold for enhanced oversight from $50 billion to $250 billion in assets. This freed regional banks from costly compliance requirements, ironically paving the way for the recent NYCB/FLG fiasco.
Easing the Volcker Rule: Loosened restrictions on proprietary trading, giving banks more flexibility.
Simplified Stress Testing: Allowed smaller institutions to avoid the same rigorous annual testing as the largest banks.
The result? Compliance costs fell, and ROEs began inching upward, particularly for regional and mid-sized institutions. However, the largest banks still faced the full weight of Dodd-Frank, ensuring systemic safeguards remained intact.
With the biggest banks now suing the Fed for Dodd-Frank and Trump in office there is one thing I’m certain of. There will be cries for less regulation. How much of it will be put into place? That’s anyone’s guess. But the trend is absolutely for less regulation from the CFPB, to capital stress testing, to easier M&A approvals. All of these things are a net positive for the banking industry.
This is a tailwind for me because fundamentally if bank capital rules are loosened it creates a world where (as mentioned earlier) buybacks pick up, ROEs pick up, and bank valuations continue to improve. In the image above, not only would this help banks climb up the curve, but it would also lift all the boats and increase the slope of the ROTCE & P/TBV correlation upwards.
Bonus Tailwind: Private Credit
But what about credit risk in the banking sector?
Well to start with, consumer charge-offs are elevated in the lower-income quartile, but this group isn’t the primary driver of GDP spend nor is the system overly levered to it. Meanwhile, upper-income consumers remain resilient, and residential credit is stable. With most homeowners locked into sub-4% rates or owning outright, a major credit issue seems unlikely without a severe unemployment spike or deep recession, not my base case.
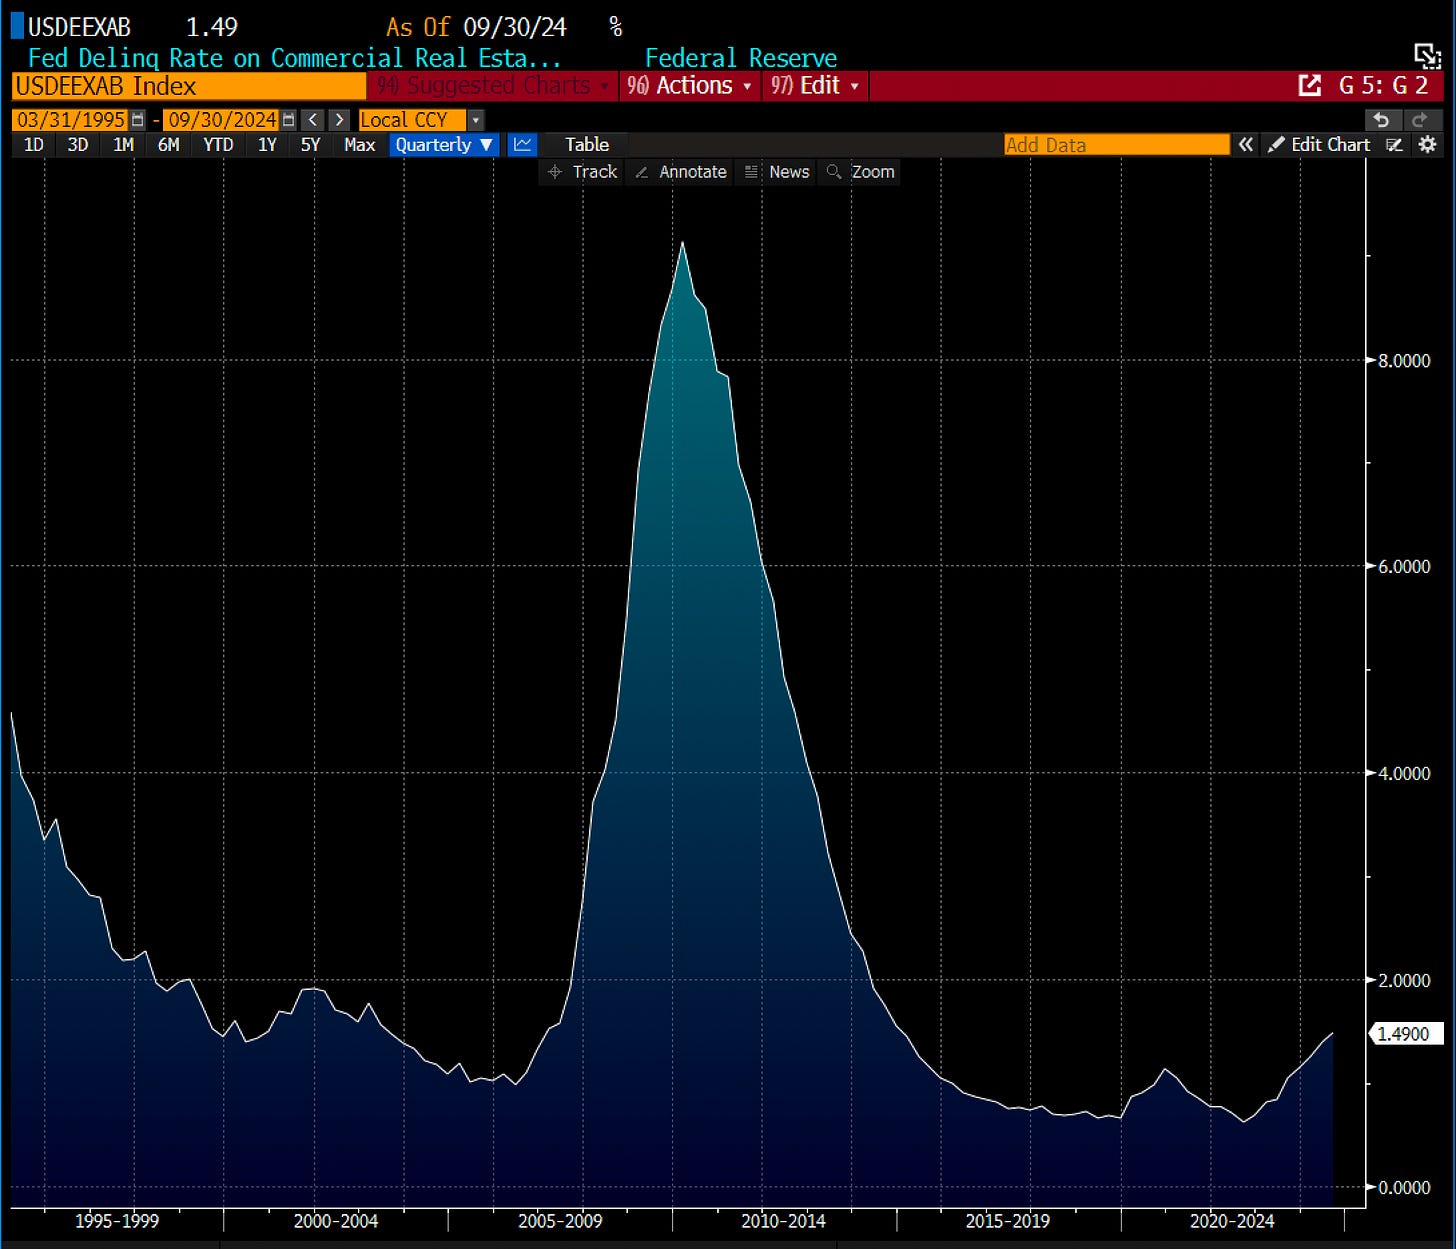
What about CRE? The media paints a dire picture, but the numbers so far have been underwhelming. Bank CRE loan delinquencies remain historically low, even if they're creeping up. Headlines may bark, but the bite has been mild. Many banks loaded up on CRE loans in 2022, with maturities often 5–7 years out—making it more of a 2027 problem, if one at all. Bank loans, as trades like VLY and HMST show, are still pricing at reasonable discounts. A bullish signal? The growing non-bank bid for riskier CRE paper, which could provide crucial support for bank credit going forward.
Enter Private Credit
Private credit refers to non-bank lending, where institutions like private equity firms, hedge funds, and specialized credit funds provide loans directly to companies or invest in all asset classes like C&I or commercial real estate (CRE). Unlike traditional banks, private credit players focus on riskier, higher-yield opportunities, often stepping into spaces banks can’t or won’t serve.
Over the past decade, private credit has grown into a $1.7 trillion industry, fueled by institutional investors seeking higher returns in a low-yield world. These funds compete with banks but also complement them.
Taking Risk Off the Table: Private credit often takes on deals banks can’t touch due to regulatory constraints. These might include loans with higher loan-to-value ratios (LTVs) or lower debt service coverage ratios (DSCRs)—essentially, riskier deals with higher returns that their more regulated counterparts can’t do.
Troubled Assets: Private credit also plays a vital role in removing troubled assets from bank balance sheets. Historically, banks were stuck holding these risky loans, weighing down their capital efficiency. Today, private credit steps in, buying these loans and freeing up banks to focus on more traditional, lower-risk lending.
For regulators, the rise of private credit poses a challenge as it operates within the "shadow banking" system—outside traditional oversight. This lack of transparency can obscure risks and create potential vulnerabilities in the financial system.
For banks, however, private credit has been a clear positive. By absorbing riskier loans, it allows banks to strengthen their balance sheets, maintain capital positions, and focus on core lending with healthier borrowers. As examples from OZK and WAL investor decks highlight, senior CRE lending at 50% LTVs leaves little room for significant losses.
Private credit’s direct lending has grown rapidly and, according to industry insiders, will continue to expand. This shift effectively transfers risk from the banking system to private credit, providing a tailwind for bank CRE portfolios and reducing overall credit risk exposure for banks.
A Time Capsule for Bank Bulls
Today’s banking landscape to me echoes the mid to late 1990s.
The mid to late 1990s marked a period of extraordinary economic performance. Real GDP growth accelerated from 2.7% in 1995 to an impressive 4.8% by 1999. Unemployment steadily declined, dropping from 5.6% to a historic low of 4.2%, reflecting a robust labor market. Inflation remained stable, easing from 2.8% in 1995 to just 1.7% in 1999—an ideal environment for lending and investment. Fiscal discipline further bolstered confidence, with budget surpluses beginning in 1998, supported by booming tax revenues and controlled spending (though achieving this again feels unlikely anytime soon).
For banks, loan volumes surged as businesses expanded and consumers thrived. Rising incomes improved credit quality, while a low-inflation, low-interest-rate environment enabled banks to grow with limited risk. It was, in many ways, a golden age for the industry.
The technology revolution of the 1990s further accelerated growth for banks, driving productivity gains, creating new industries, and fueling the dot-com boom. Rapid IT adoption reshaped industries, and banks were well-positioned to capitalize on the surge in IPOs, increased M&A activity, and heightened demand for financing.
This period of transformation thrived for three key reasons. Strong economic growth expanded loan demand, improved credit quality, and boosted consumer confidence. A steep yield curve, with 10-year Treasury yields around 6.5% in 1999 and lower short-term rates, provided banks with healthy net interest margins (NIMs). Finally, technological advancements, including online banking and automation, allowed banks to scale operations efficiently and enhance customer service. Together, these factors created a fertile environment for banking success.
Parallels to Today
Fast-forward to 2024, and the parallels to the late 1990s are striking. GDP growth, while not as rapid as the ’90s, has exceeded expectations, reflecting economic resilience—and Trump’s pro-growth policies could amplify this further. Bank earnings, which took a hit in 2023, are rebounding, with analysts forecasting mid- to high-teens EPS growth through 2026. Credit and liquidity fears, much like in the ’90s, are dissipating. Meanwhile, the prolonged yield curve inversion is ending, with even modest slope improvements boosting net interest margins (NIMs), creating an environment that rhymes with the mid to late 1990s and early 2000s.
The rise of private credit and fintech innovations mirrors the Dot Com era’s transformative effect, with today’s AI boom driving productivity gains much like the tech revolution of the ’90s. While unique challenges like higher debt burdens and geopolitical uncertainty persist, history shows that banks can thrive for extended periods when macroeconomic conditions align, compounding strong returns and earnings growth.
It’s also worth noting that banks largely escaped the fallout of the Dot Com crash in 2000. Disruption in the tech sector doesn’t have to make banks cyclical, proving their resilience even amid broader market turmoil.
Good Environments for Banks Produce Returns
The late 1990s saw exceptional growth for banks, and the results speak for themselves as seen through these two analogs.
Wells Fargo (WFC): EPS grew from $0.70 to $2.45 (11.0% CAGR), while its stock price surged from $6 to $29 (14.0% CAGR).
Bank of America (BAC): EPS climbed from $1.30 to over $4.00 (9.8% CAGR), with its stock price jumping from $11 to $50 (13.4% CAGR).
This sustained earnings and stock performance highlights how the right macroeconomic conditions—sloped yield curves, stable regulation, and a strong economy—can drive exceptional results. That and just sitting back, relaxing, and enjoying the ride. Let the compounders ride.
I’m seeing banks continuing their run. I’ll change my mind if data changes. But for now, the case for boring 15% a year returns are there with some substantial upside along the way.
Until next time,
Victaurs
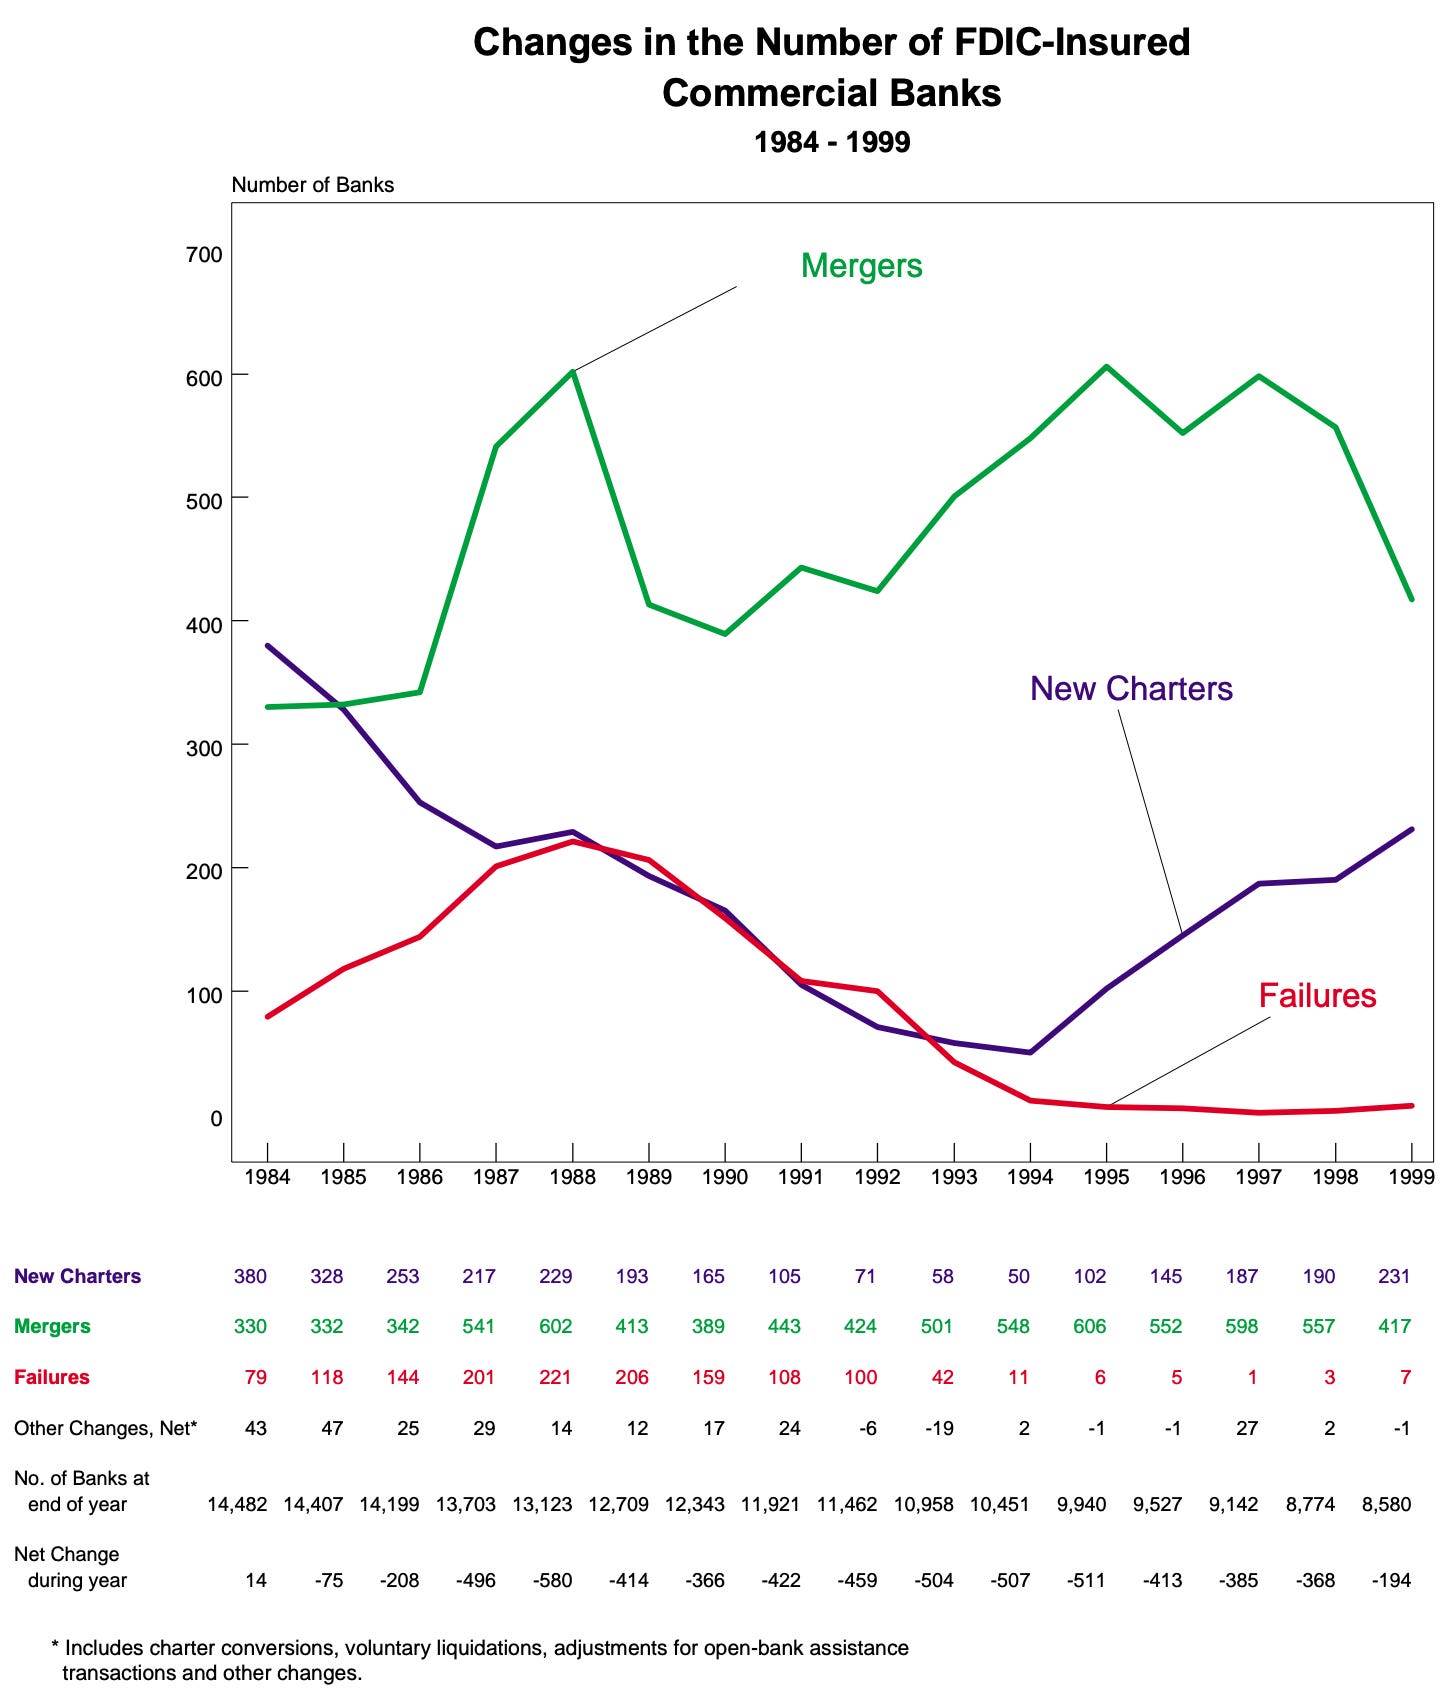
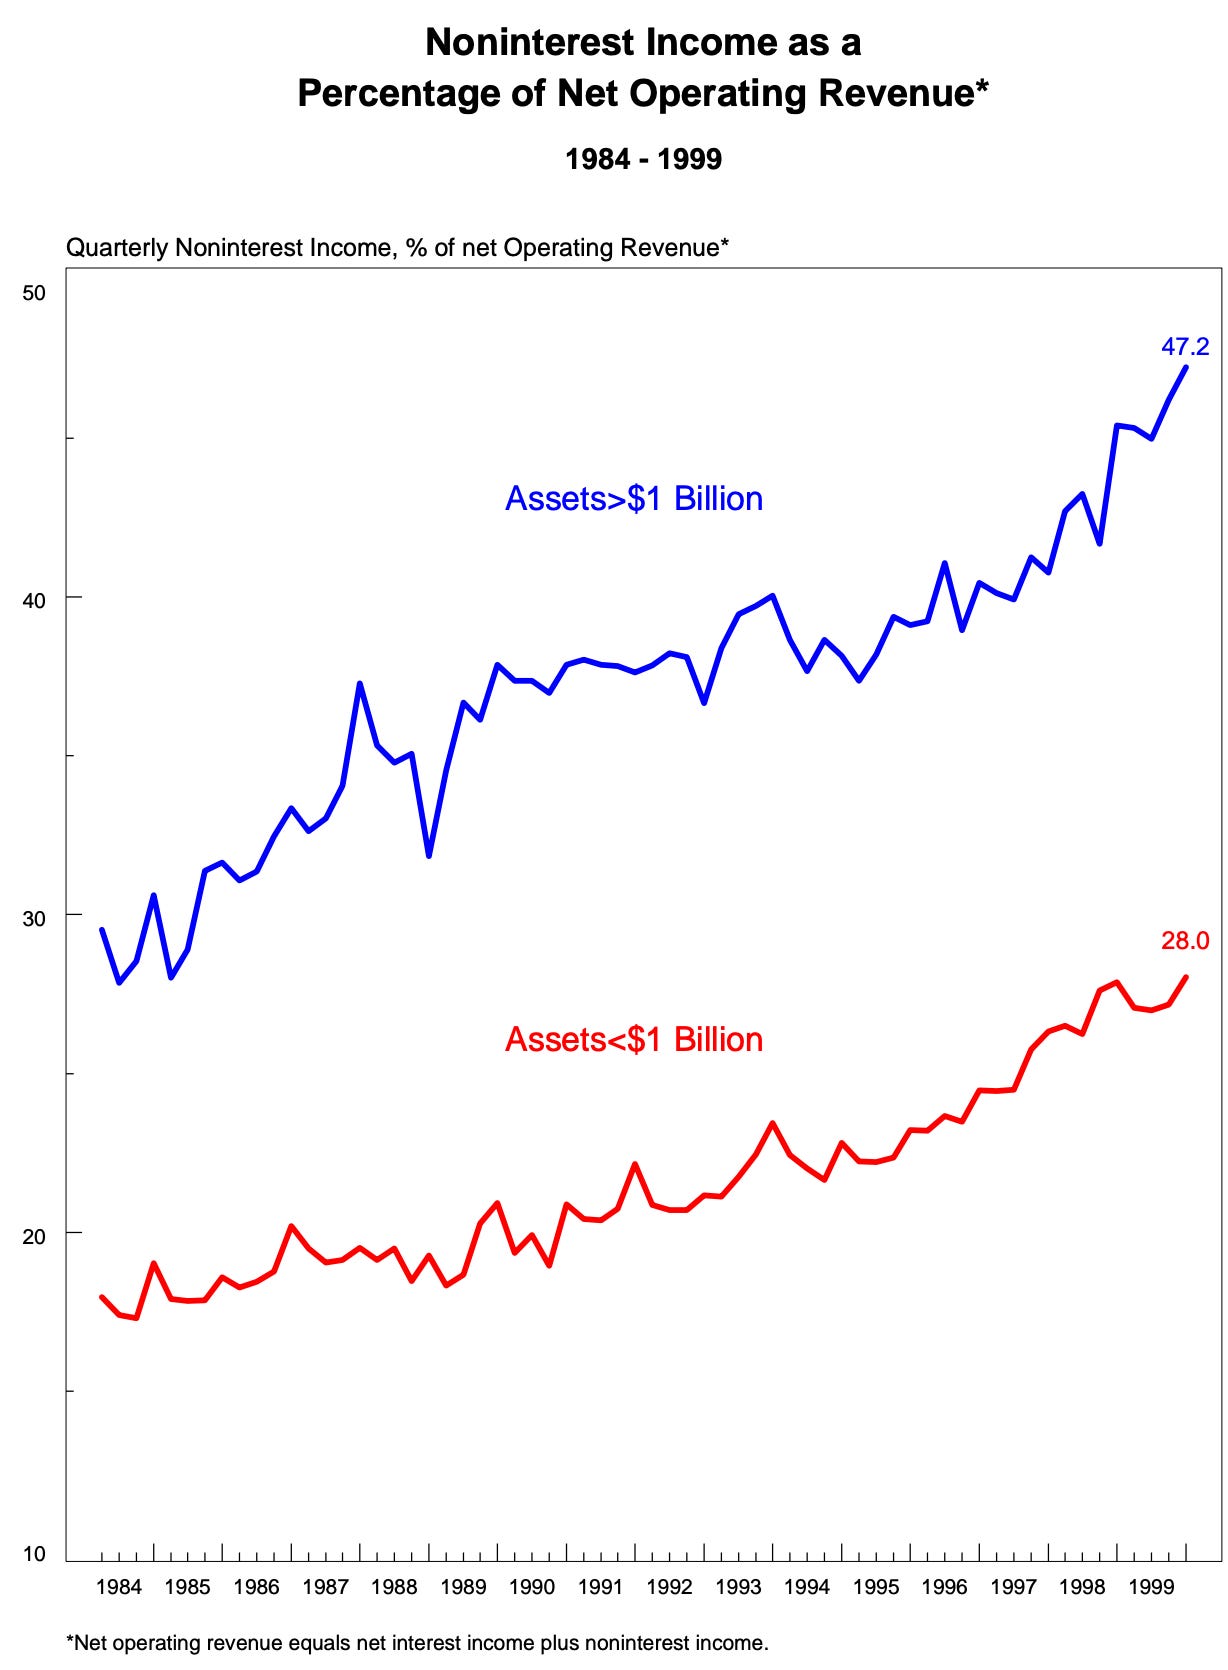
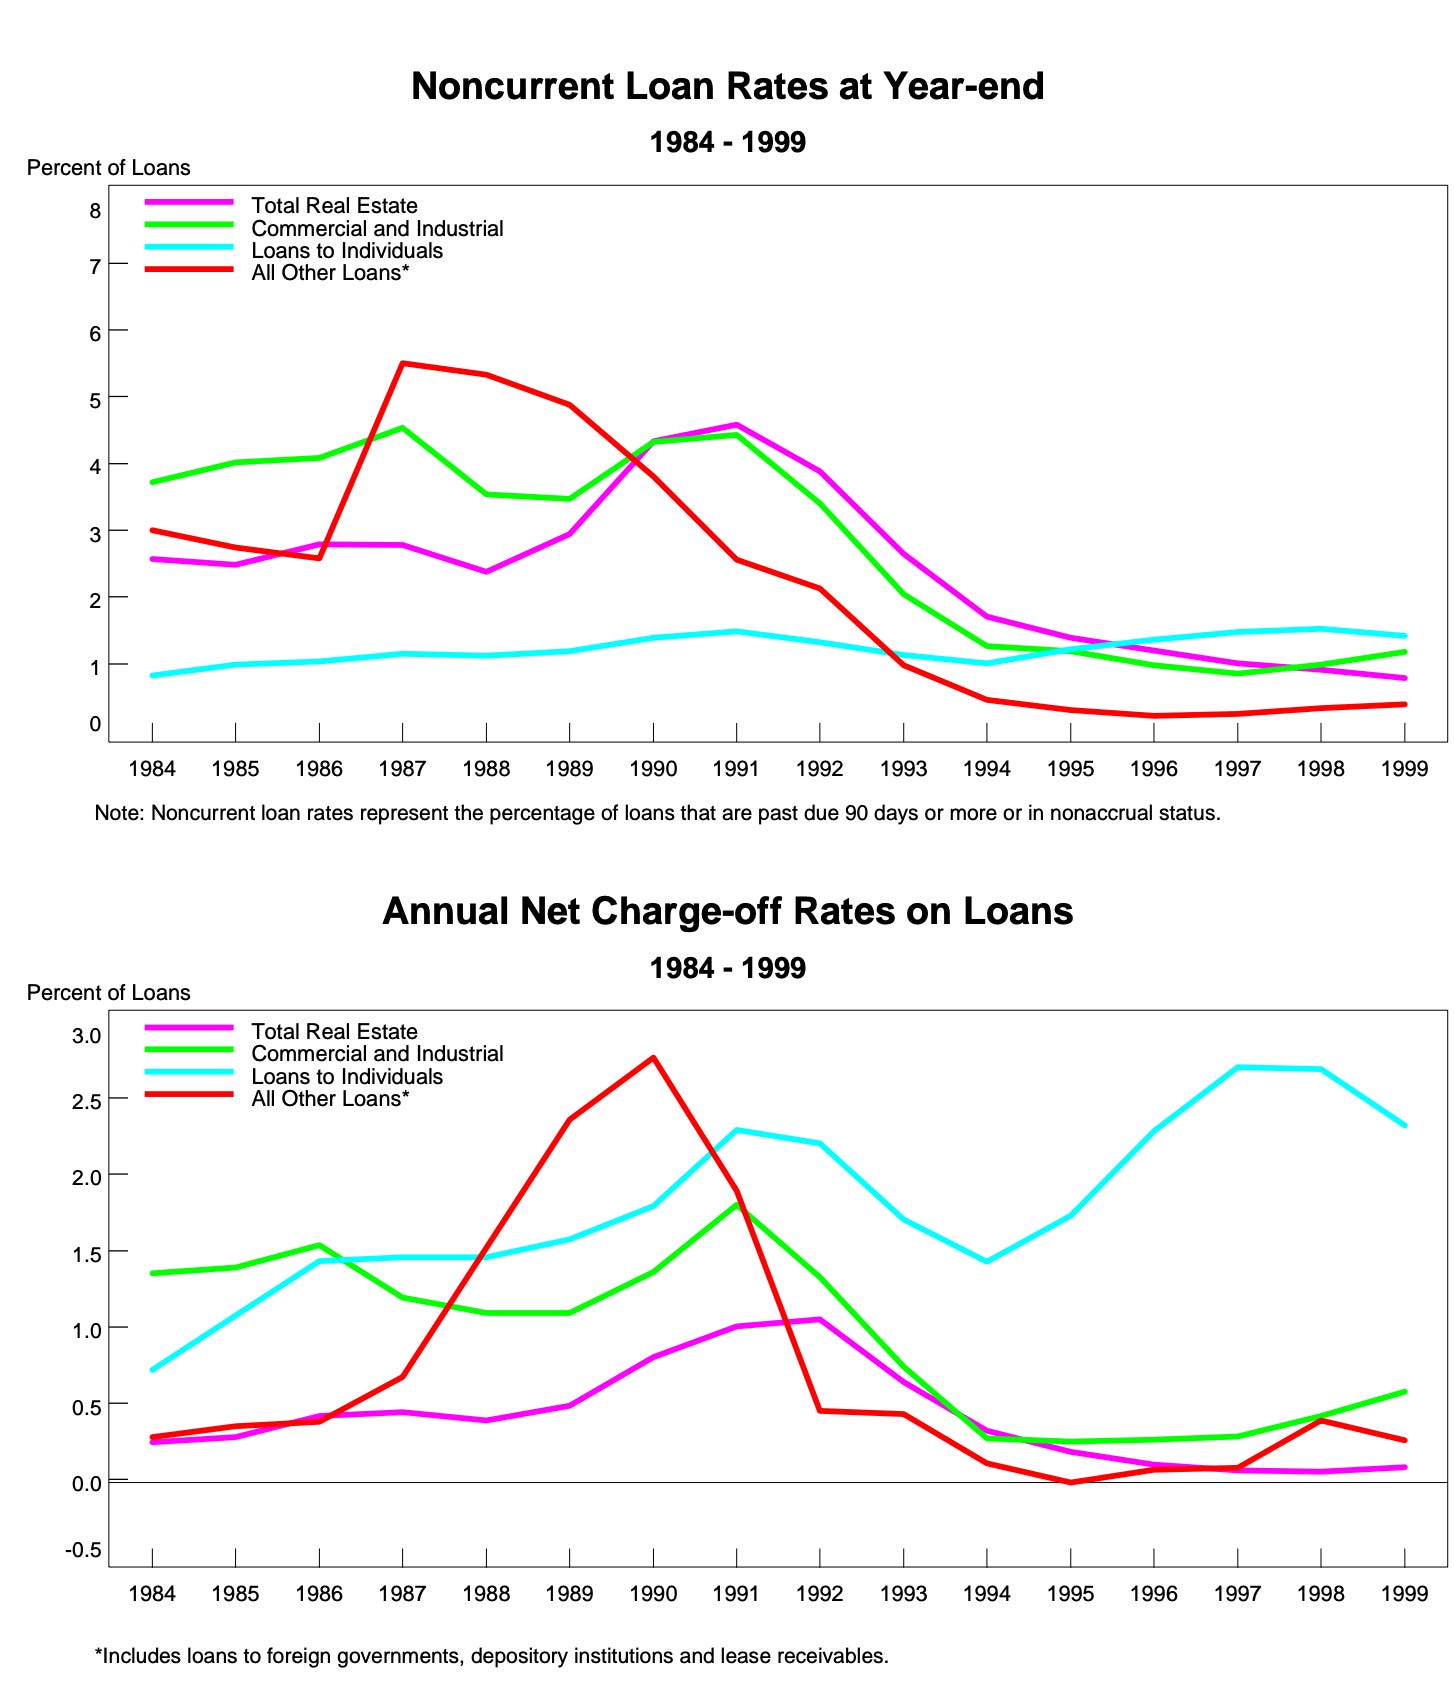
PS - some fun historical context graphics from the 1999 FDIC Bank Quarterly Review. The more things change, the more things stay the same. FDIC 1999.


